
 After Its Strong 2024 Share Price Run?")
- If you are wondering whether Chord Energy at around US$134.93 is still offering value, the key question is how its market price compares with its fundamentals.
- The stock has had a mixed short term path, with a 1.5% decline over the last 7 days, a 9.5% gain over the last 30 days, and returns of 42.5% year to date and 49.5% over the past year.
- Recent coverage has focused on Chord Energy’s position within the wider oil and gas sector and how investor sentiment around the company aligns with that backdrop. These headlines give context for the share price moves and frame the debate about whether the current valuation leaves much upside or adds extra risk.
- Chord Energy currently holds a valuation score of 5 out of 6, which suggests the stock screens as undervalued on most of the checks used in this framework. The next sections will break down those valuation methods and outline a more detailed way to think about what the shares may be worth.
Find out why Chord Energy’s 49.5% return over the last year is lagging behind its peers.
Approach 1: Chord Energy Discounted Cash Flow (DCF) Analysis
A Discounted Cash Flow, or DCF, model estimates what a business might be worth by projecting the cash it could generate in the future and then discounting those cash flows back to today.
For Chord Energy, the model used is a 2 Stage Free Cash Flow to Equity approach based on cash flow projections. The latest twelve month Free Cash Flow is about $842.8 million. Analyst inputs and extrapolated estimates include Free Cash Flow figures such as $765 million in 2026 and $828 million in 2030. Simply Wall St extends the projections out to 2035 using gradual adjustments rather than relying on analyst targets alone.
When all of these projected cash flows are discounted back to today in this framework, the estimated intrinsic value is about $328.40 per share. Compared with a recent share price around $134.93, this calculation implies a discount of 58.9%, which indicates that Chord Energy is trading well below this DCF estimate.
Result: UNDERVALUED
Our Discounted Cash Flow (DCF) analysis suggests Chord Energy is undervalued by 58.9%. Track this in your watchlist or portfolio, or discover 64 more high quality undervalued stocks.
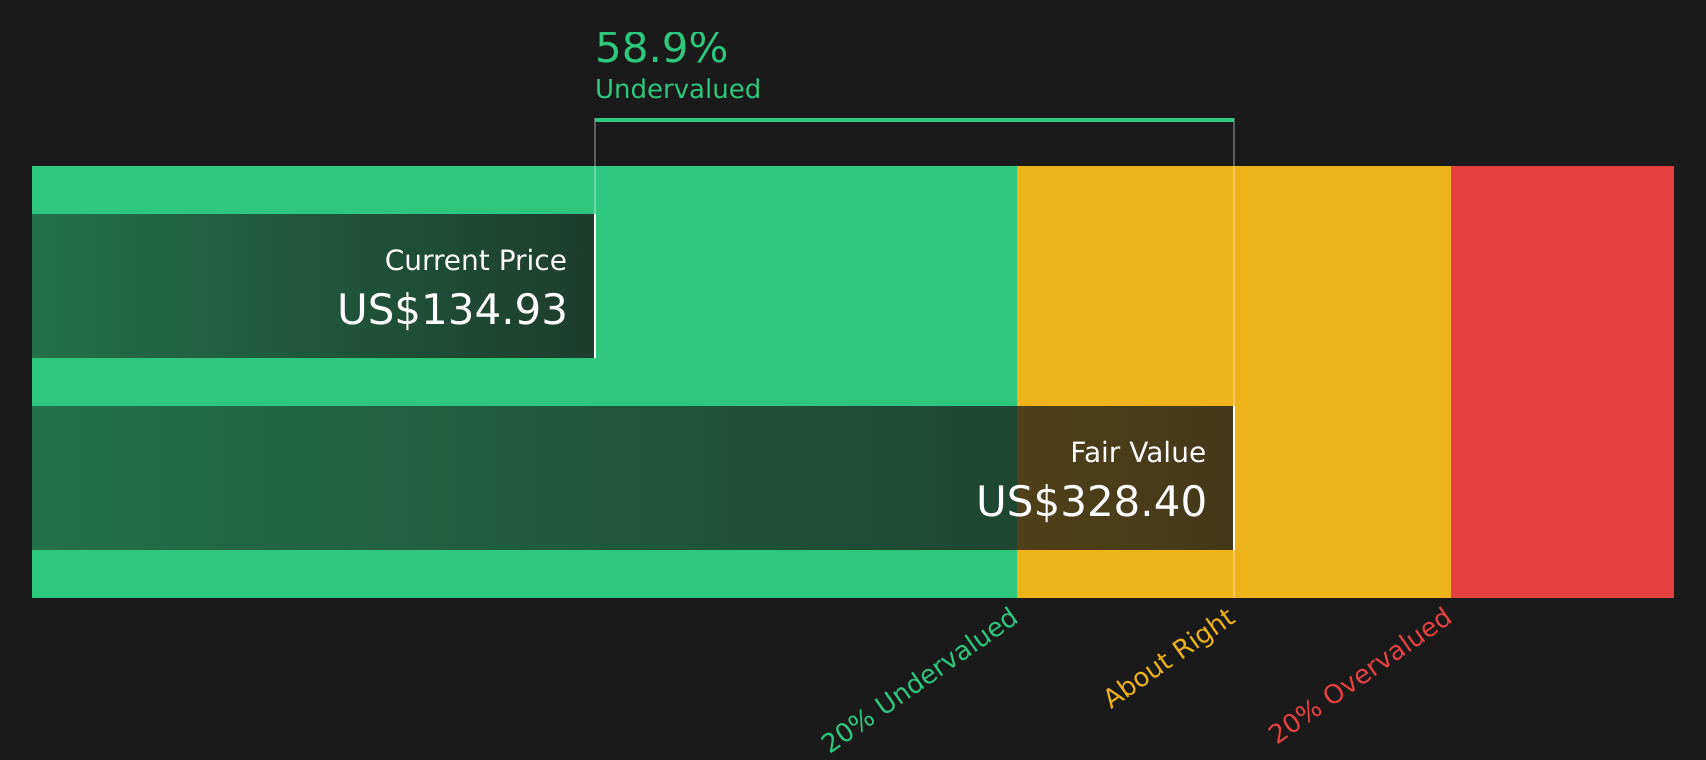 CHRD Discounted Cash Flow as at Apr 2026
Approach 2: Chord Energy Price vs Sales
For profitable companies, revenue-based metrics like the Price to Sales, or P/S, ratio can be helpful because they compare what the market is paying for each dollar of sales, which is usually more stable than earnings for cyclical businesses.
Growth expectations and risk levels both influence what a “normal” P/S ratio should be. Investors often accept a higher multiple if they expect stronger revenue growth or see lower business risk, and usually look for a lower multiple when growth is modest or risks are higher.
Chord Energy currently trades on a P/S ratio of 1.67x. This sits below the Oil and Gas industry average of 2.04x and also below the peer group average of 1.94x. Simply Wall St’s Fair Ratio for Chord Energy is 1.95x, which represents the P/S multiple suggested by its model after assessing factors such as earnings growth, industry, profit margin, market cap and risk profile.
The Fair Ratio can be more informative than a simple industry or peer comparison because it is tailored to the company’s specific characteristics rather than relying on broad group averages. Comparing Chord Energy’s current 1.67x P/S with the 1.95x Fair Ratio suggests the shares are pricing in a discount on this metric.
Result: UNDERVALUED
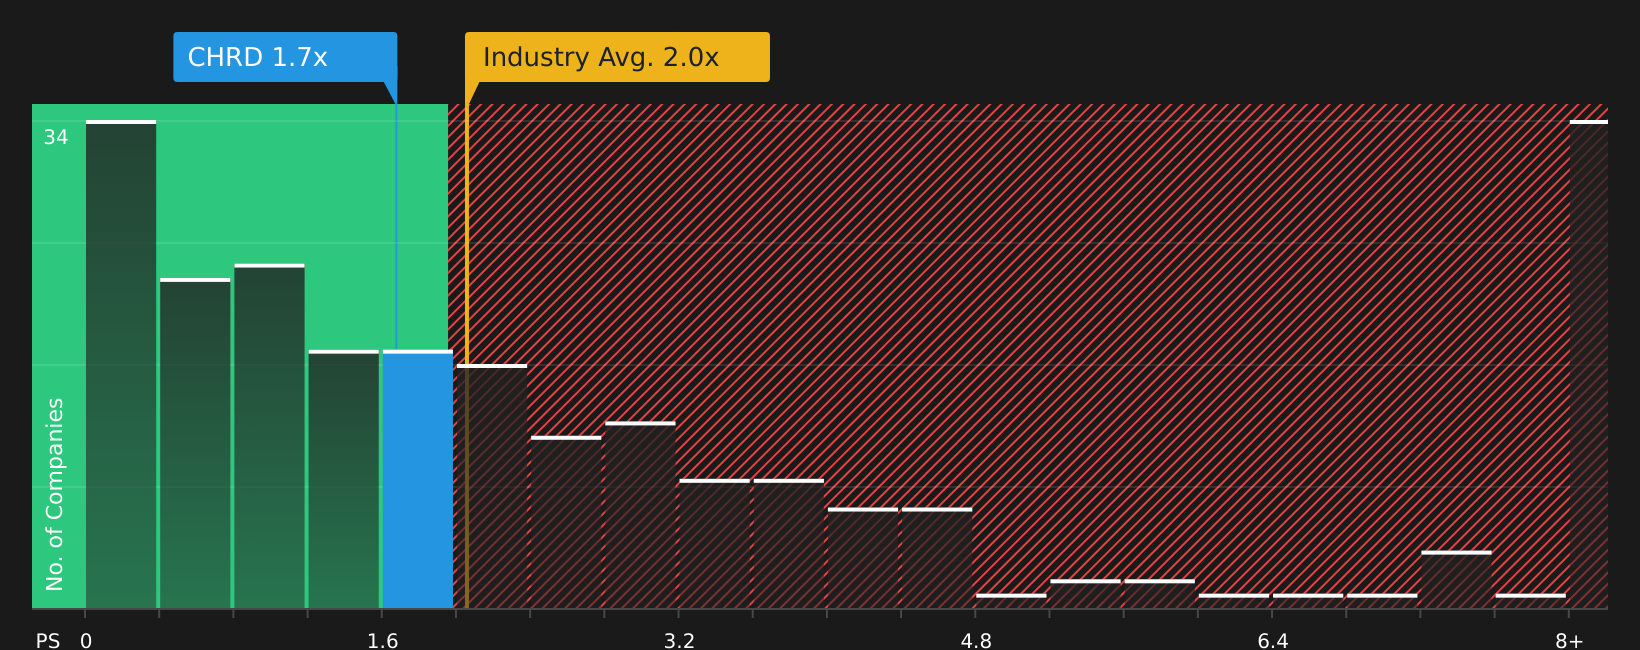 NasdaqGS:CHRD P/S Ratio as at Apr 2026
P/S ratios tell one story, but what if the real opportunity lies elsewhere? Start investing in legacies, not executives. Discover our 19 top founder-led companies.
Upgrade Your Decision Making: Choose your Chord Energy Narrative
Earlier it was mentioned that there is an even better way to understand valuation. Narratives bring this to life by letting you attach a clear story about Chord Energy to your own numbers. You can link what you believe about future revenue, earnings and margins to a forecast, then to a Fair Value that you can easily compare with the current share price on Simply Wall St’s Community page, where millions of investors share views. Those Narratives then update automatically when new data such as news or earnings arrives. In practice, one investor might build a cautious Chord Energy Narrative that lines up with a Fair Value around US$114, while another might build a more optimistic one closer to US$155. By seeing both side by side you can quickly decide whether the current price looks high or low relative to the story you find more convincing.
For Chord Energy, here are previews of two leading Chord Energy narratives to help frame your own view:
Fair value in this bullish narrative: US$137.94 per share.
Implied discount to this fair value versus the recent US$134.93 share price: about 2.2%.
Revenue growth assumption: 1.9% per year.
- Focuses on longer lateral wells, data-driven operations, and cost control to support margins and free cash flow.
- Assumes steady revenue growth, rising profit margins, and ongoing buybacks reducing the share count.
- Highlights risks around regulation, shale decline rates, energy transition, and access to capital that could challenge this optimistic path.
Fair value in this bearish narrative: US$114.00 per share.
Implied premium to this fair value versus the recent US$134.93 share price: about 18.4%.
Revenue growth assumption: 0.2% per year.
- Builds on flat revenue expectations, lower profit margins than the bullish case, and a higher required P/E to justify the share price.
- Stresses the impact of faster decarbonization, regulation, and potential basin or infrastructure limits on long term earnings and cash flow.
- Accepts that operational efficiencies and technology could help, but still treats current market expectations as demanding for the risks involved.
Both narratives use the same company, the same region, and many of the same data points, yet they reach very different views on what the shares are worth. Your job is to decide which set of assumptions feels closer to your own, and then see how the current US$134.93 price lines up with that story.
Do you think there’s more to the story for Chord Energy? Head over to our Community to see what others are saying!
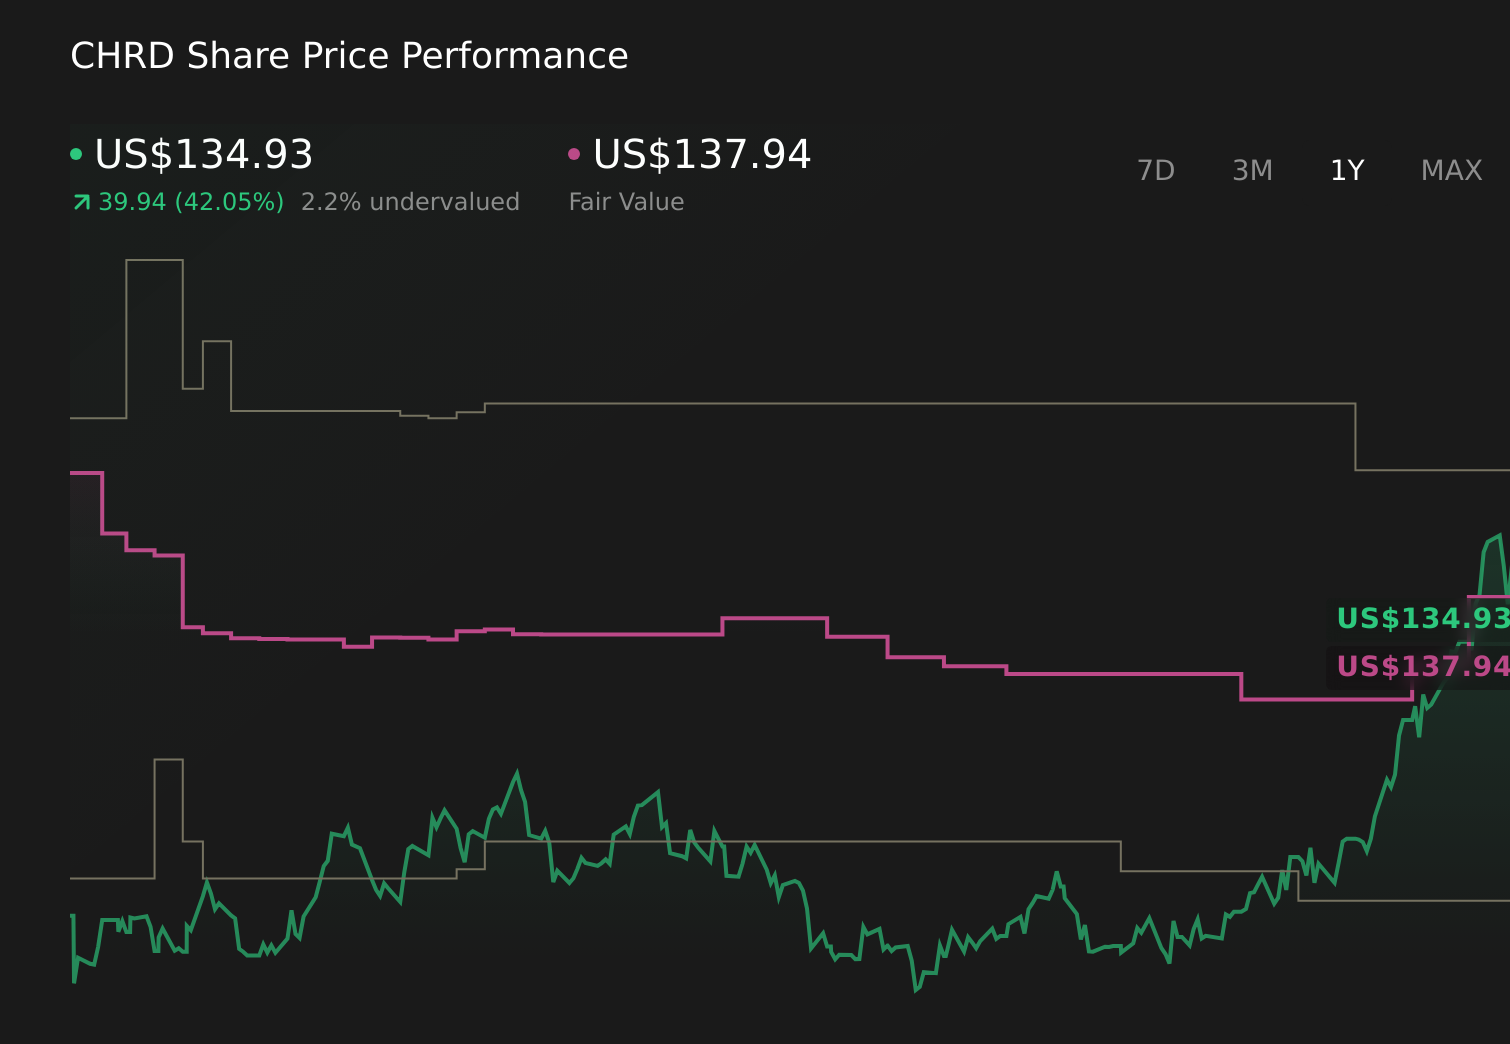 NasdaqGS:CHRD 1-Year Stock Price Chart
This article by Simply Wall St is general in nature. We provide commentary based on historical data
and analyst forecasts only using an unbiased methodology and our articles are not intended to be financial advice. It does not constitute a recommendation to buy or sell any stock, and does not take account of your objectives, or your
financial situation. We aim to bring you long-term focused analysis driven by fundamental data.
Note that our analysis may not factor in the latest price-sensitive company announcements or qualitative material.
Simply Wall St has no position in any stocks mentioned.
Our new AI Stock Screener scans the market every day to uncover opportunities.
• Dividend Powerhouses (3%+ Yield)
• Undervalued Small Caps with Insider Buying
• High growth Tech and AI Companies
Or build your own from over 50 metrics.
Have feedback on this article? Concerned about the content? Get in touch with us directly. Alternatively, email editorial-team@simplywallst.com