

March was a dynamic month in the Arctic, with extreme of temperatures and precipitation, and, overall, (near) record low sea ice extent.
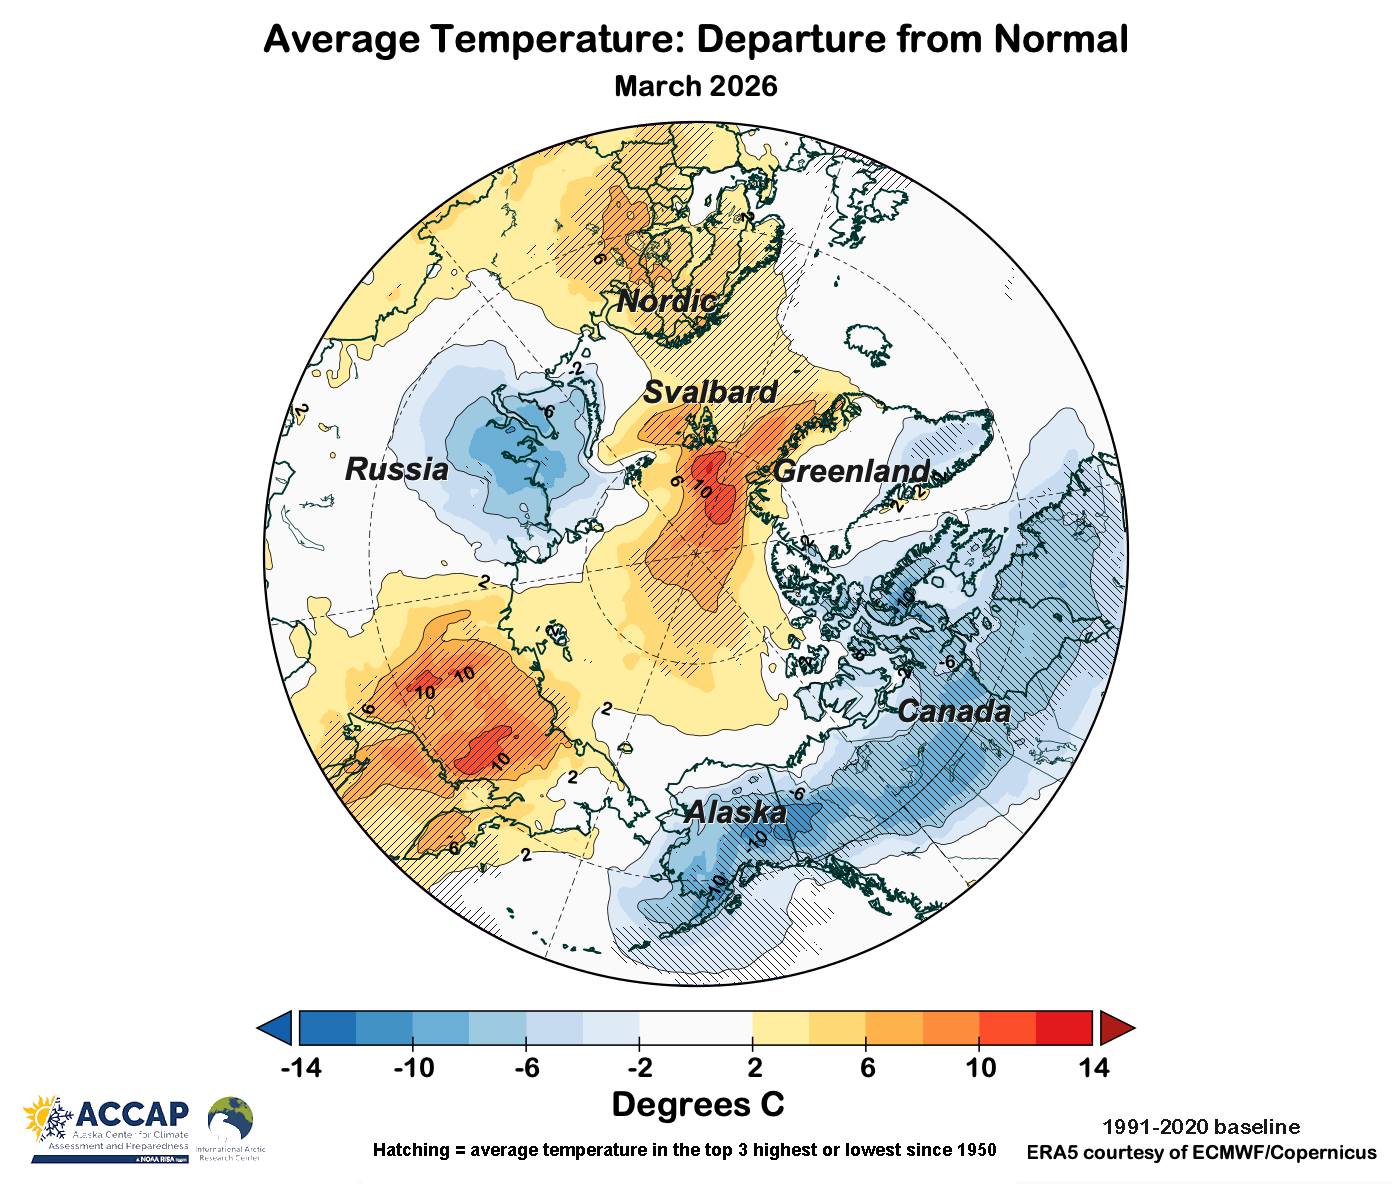
Temperatures in March in the Arctic were characterized by extensive areas where temperatures were far from normal (Fig. 1). These extremes largely balanced out, so for the Arctic overall (land and seas poleward of 60°N) the March average temperature was only 0.2°C above the 1991-2020 average based on ERA5 reanalysis.
Most of the North American Arctic was quite cold, including areas in eastern Canadian Arctic that had a mild mid-winter season. The Yukon Territory, Canada had the coldest March since 1950. Northwest Territories, Canada had the second coldest (only 1964 was colder), and Nunavut, Canada the third coldest (1961 and 1964 were colder). This was sixth coldest March for Alaska but the second coldest since 1972 (2007 was colder).
On the flip side, in the the Russian far northeast, Magadan Oblast, north of the Sea of Okhotsk, had the warmest March on record and the vast Sakha Republic the fourth warmest March. In the European Arctic, Norway, Sweden and Finland had the mildest March on record and Svalbard had the third warmest March.
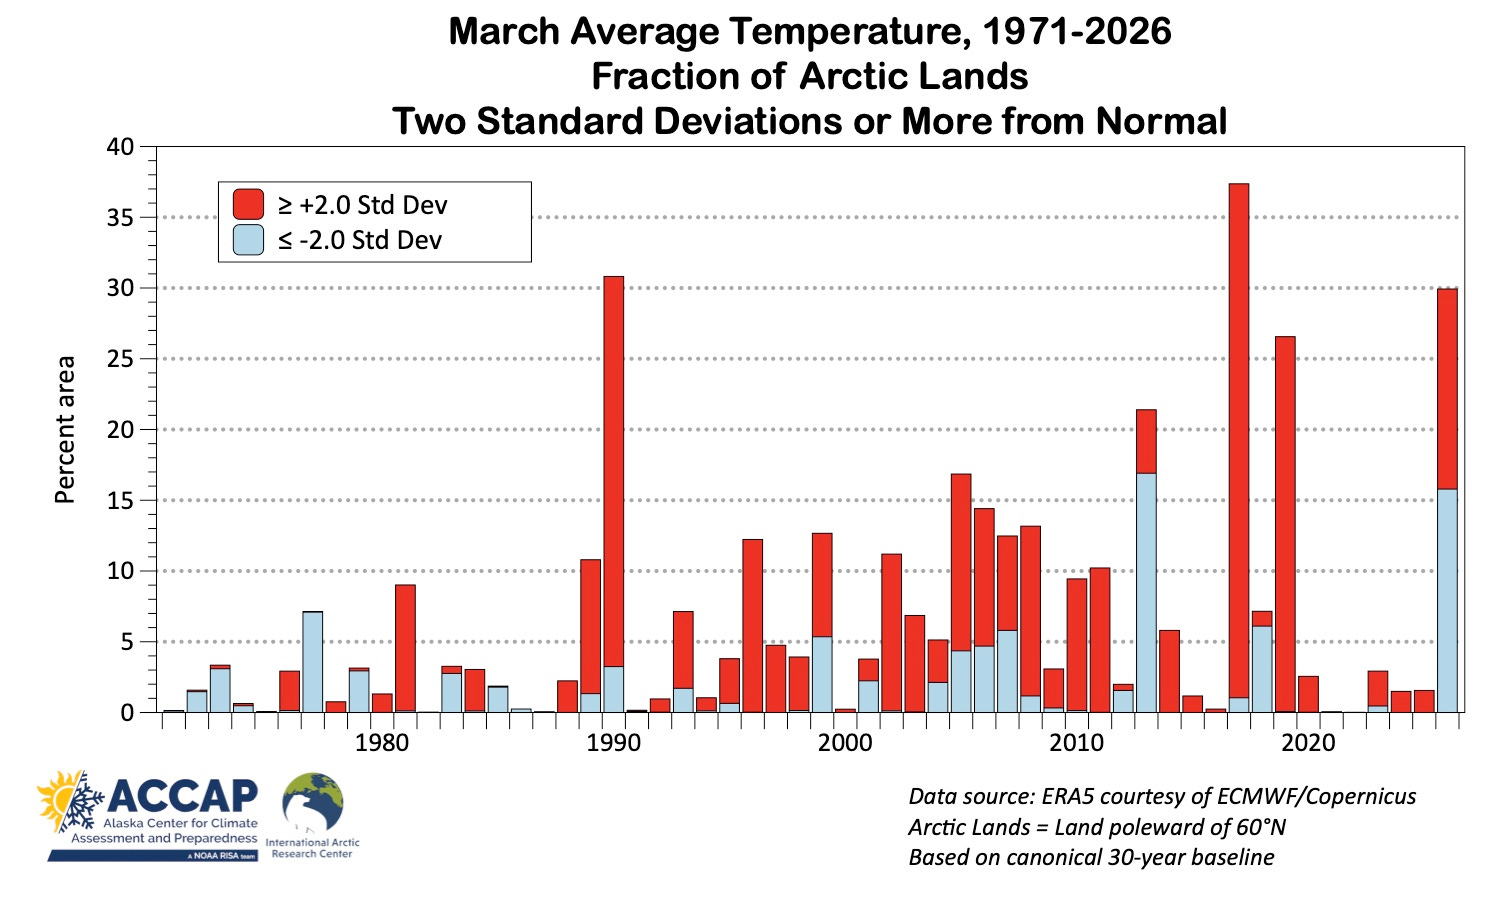
March average temperature ranked as the 17th highest since 1950 and was not especially mild by recent standards (Fig. 2). However, in a reflection of the strong trend, prior to 1990 this would have been the warmest March.

An outstanding feature of March temperatures in the Arctic were widespread large differences from normal. Overall, nearly 30 percent of the Arctic had a “top three” warmest or coldest March: 21 percent on the warm side and and 9 percent had a top three top coldest March since 1950. Arctic lands were even more dramatic: 19 percent had a top three warmest March and 26 percent, nearly all of that in North America, had a top three coldest March.
Almost every month there are some areas with unusually high or low temperatures. Often these extremes occur over only a small fraction of the Arctic, but occasionally extremes cover much larger areas. We can examine how the “area with extreme temperatures” vary by plotting the fraction of the Arctic where temperatures exceeded some threshold. Plotting the area where temperatures were more than two standard deviations from normal (think of this as “much above” and “much below” normal, Fig. 3), we see this March was unusual but not unprecedented. More unusual was the balance between the warm and cold extremes: both 1999 and 2007 were roughly similar, though not with so large an area.
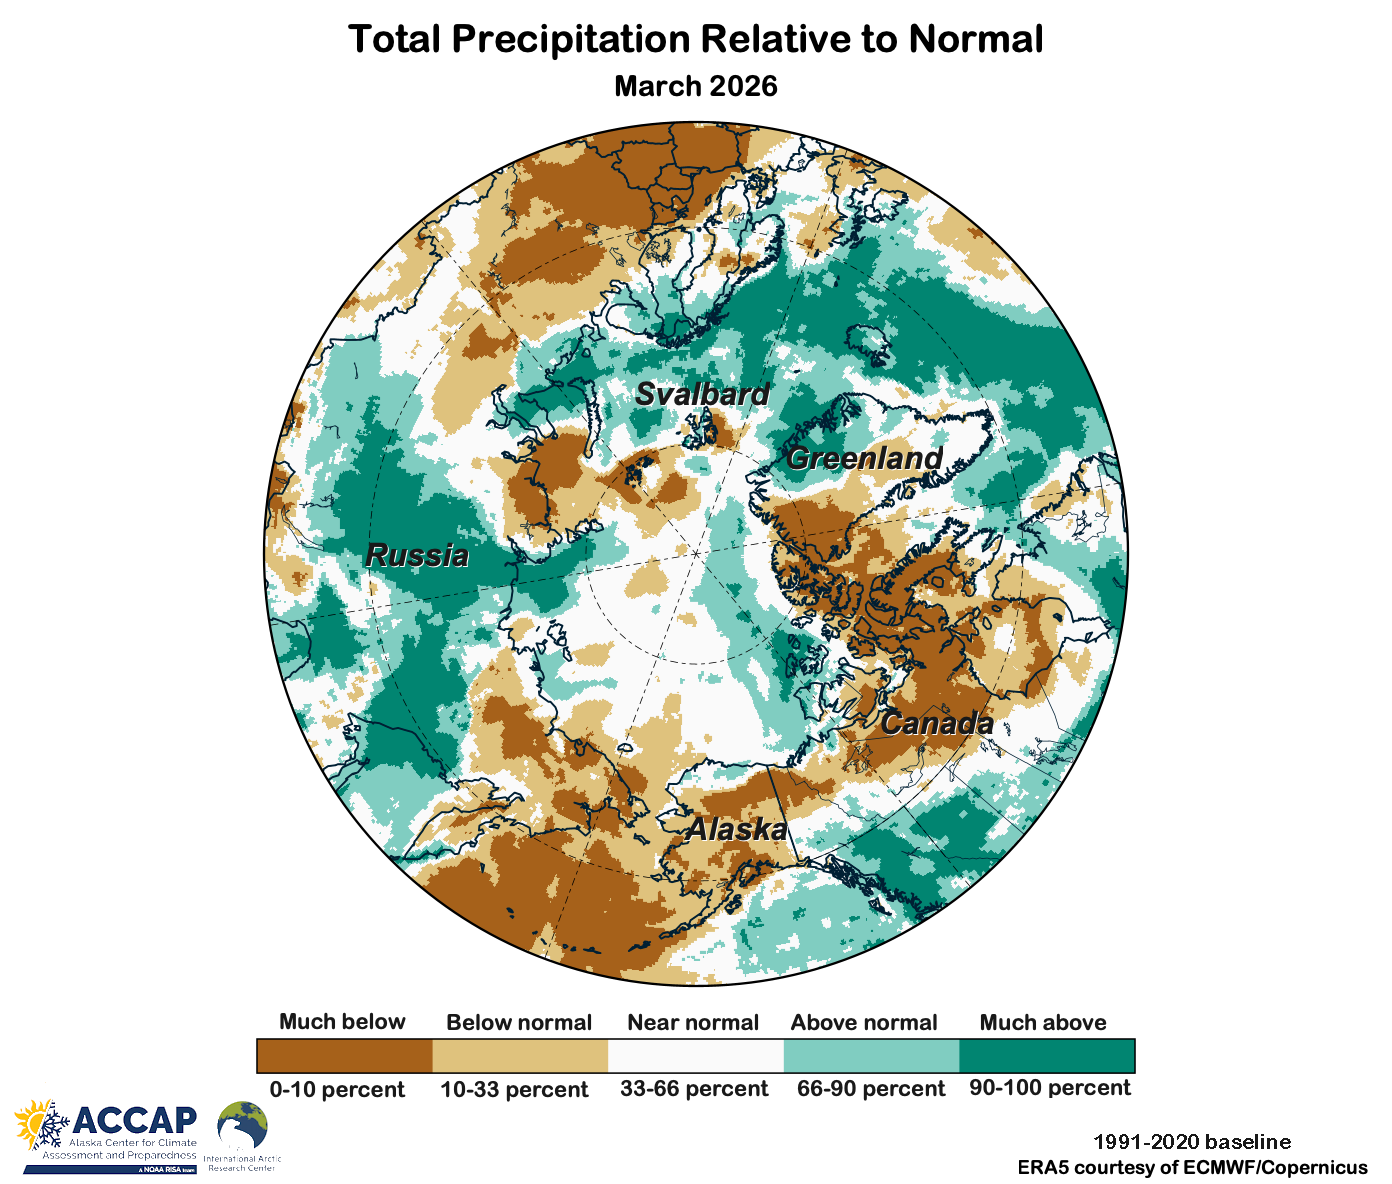
March average precipitation is quite low over much of the Arctic except for the Atlantic Arctic. This year, March totals were especially low across much of the North American Arctic as well as far northeast Russia and northwest Greenland. For Nunavut, Canada, this was driest March in ERA5 reanalysis since 1950 and both Alaska and Chukotka, Russia had the sixth driest March. In a significant change from February, the Atlantic Arctic had well above normal precipitation, including the third highest March total for Iceland since 1950.
Arctic-wide average sea ice extent for March was the second lowest on record in National Snow and Ice Data Center analysis, just barely above March 2025. Both the EUMETSAT OSI SAF and the Japanese Aerospace Exploration Agency (JAXA) analyzes put March average ice extent very slightly lower than March 2025 and so the lowest in the satellite era.
In most of the peripheral Arctic seas, March ice extent was below normal, including by far the lowest of record for the month in the Sea of Okhotsk (west of the Kamchatka Peninsula). A notable exception was the eastern Bering Sea, where March ice extent was the highest since 2012.
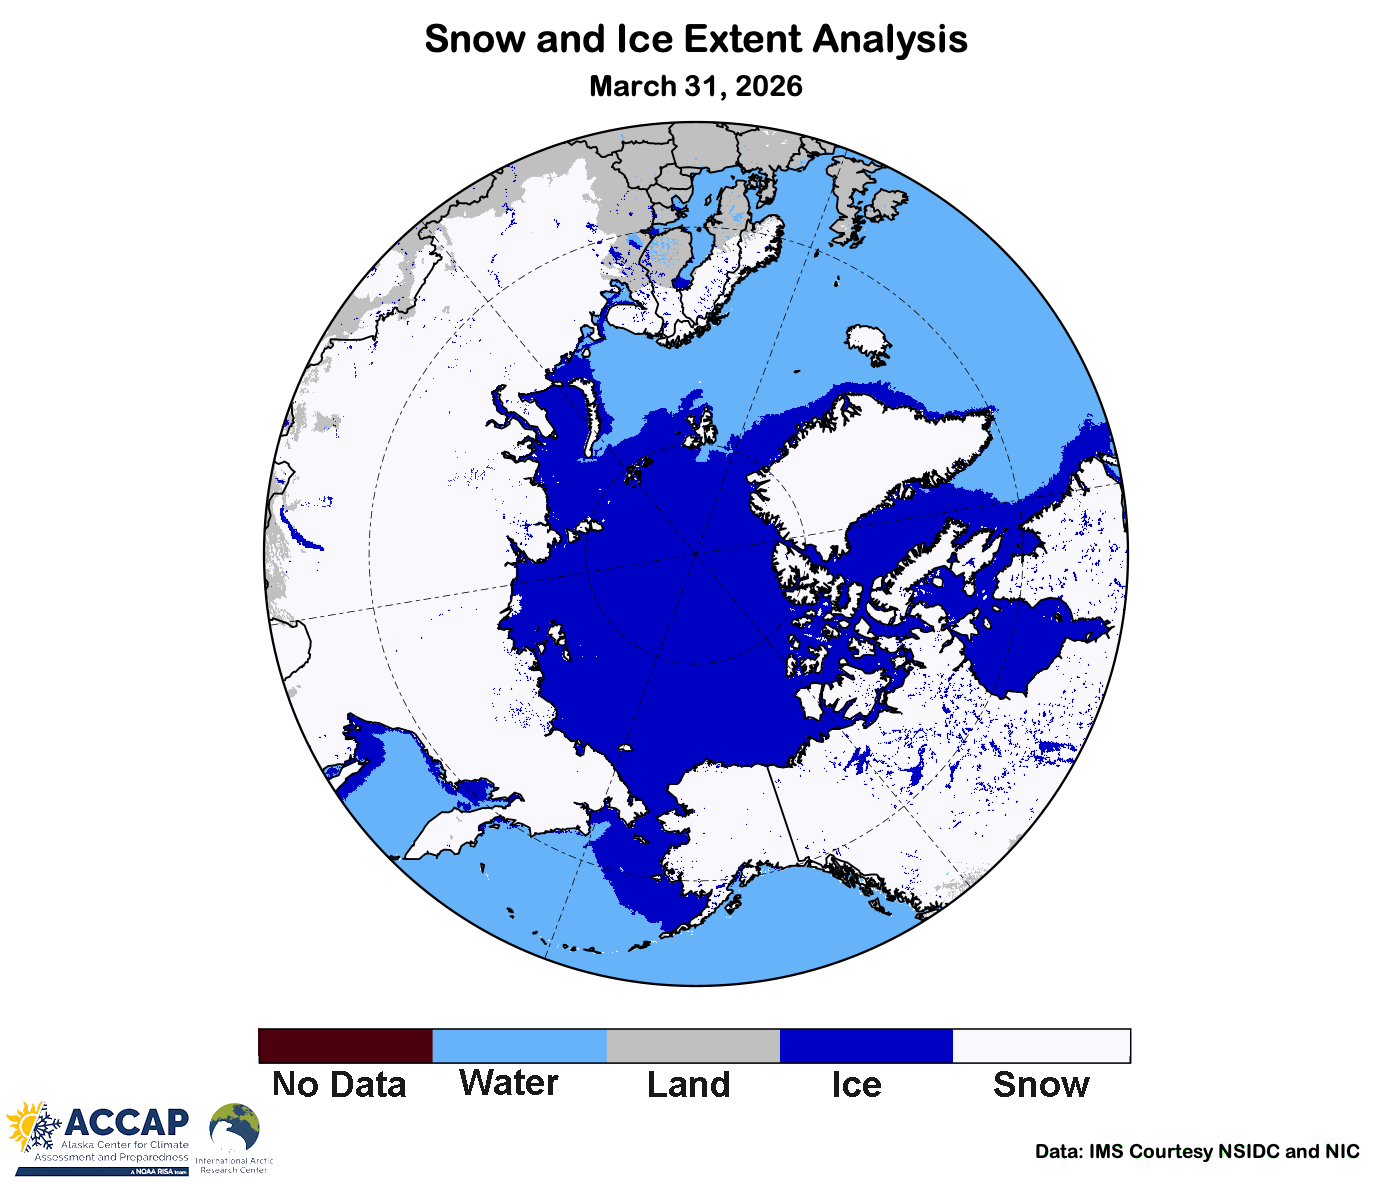
In most years nearly all Arctic land areas still have snow cover at the end of March. However, with low snow during mid-winter and the extremely mild March, there were significant areas in the Nordic Arctic, especially Finland and far northeast Russia, that had largely bare ground at the end of the month (Fig. 5) in the Interactive Multisensor Snow and Ice Mapping System (IMS) analysis produced by the U.S. National Ice Center.
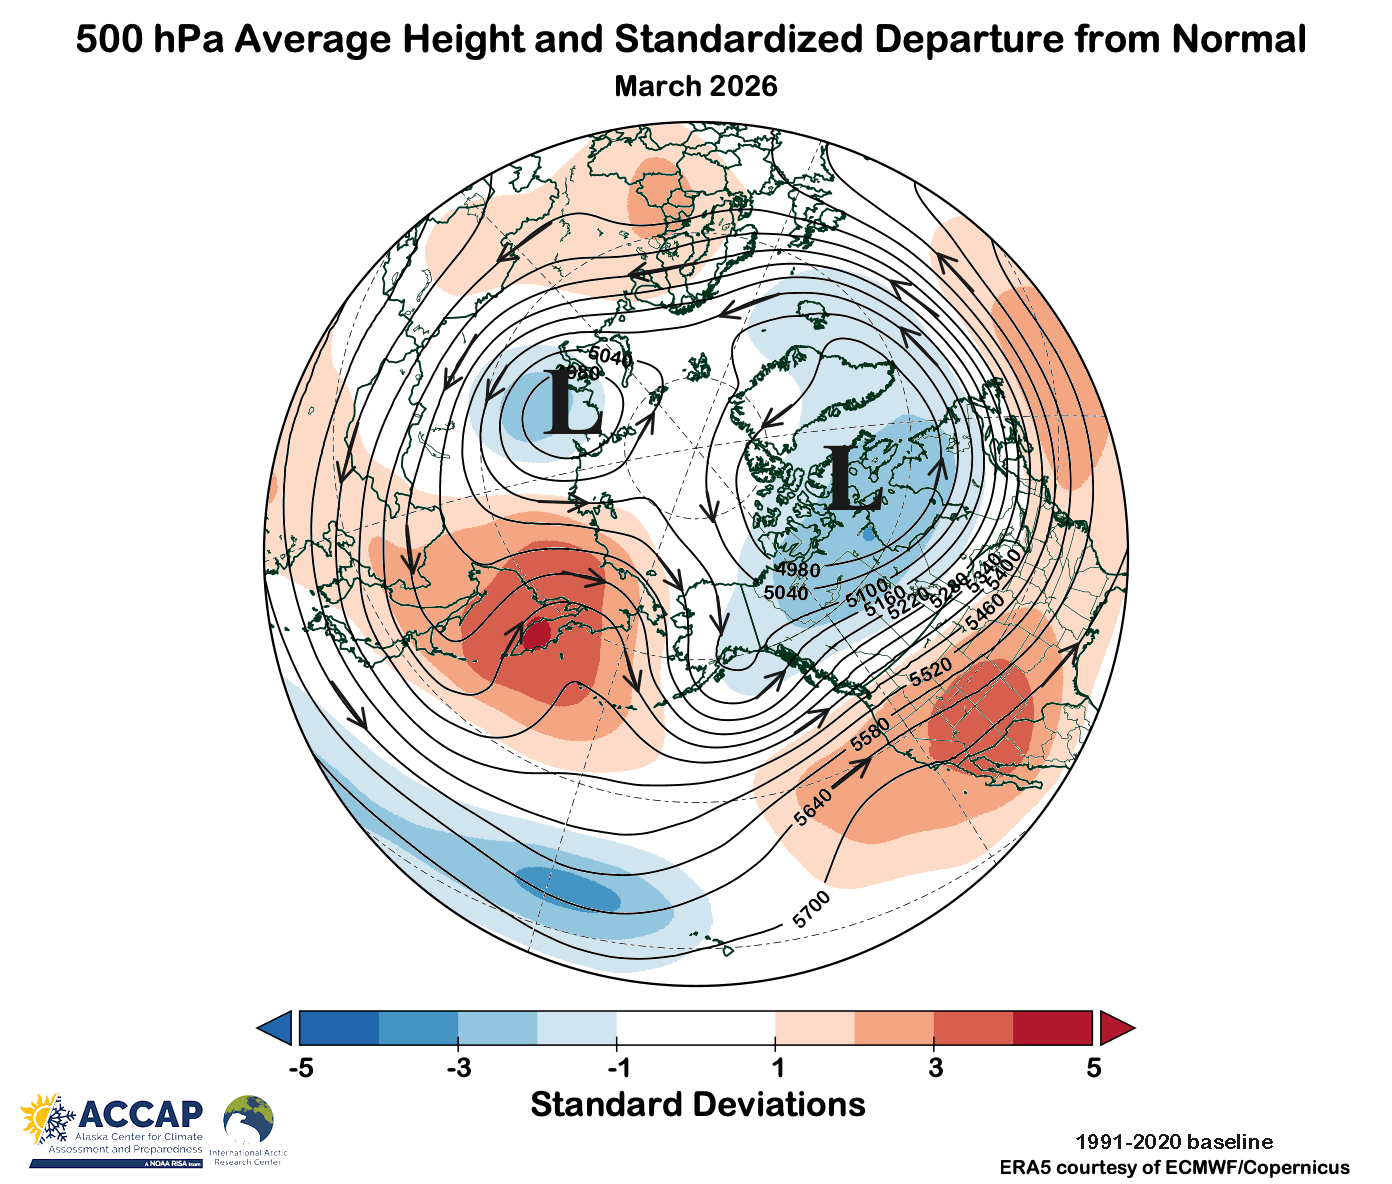
The mid-level flow pattern in March (Fig. 6) featured very strong high pressure over the western Bering Sea and Kamchatka Peninsula and broad but more modest high over central Europe, extending north into the Nordic Arctic. Broad cold low pressure was centered over northeast Canada and a smaller cold low was anchored over northwestern Siberia. The departures were quite large, with a sizable area over the western Bering Sea high more than three standard deviations above normal, while the two low centers were associated departures of more than two standard deviations below normal. These features correlate very well with the monthly surface temperatures.
Technical DetailsAs usual in this newsletter, Arctic means “poleward of 60°N” unless otherwise specified.ERA5 monthly temperature and precipitation data available through the Copernicus Climate Data Store, here.Code by B. Brettschneider/NWS Alaska Region allowing rapid ERA5 regional analysis is invaluable for my work.IMS Snow and ice analysis products are available through the landing page here. Note that there is no information in this product about the depth or water content of the snowpack or sea ice thickness or type.