Find winning stocks in any market cycle. Join 7 million investors using Simply Wall St’s investing ideas for FREE.
-
If you are wondering whether Pembina Pipeline is priced fairly or if there is still value on the table, this article walks through the key signals that matter most for shareholders.
-
The stock last closed at C$59.29, with returns of 1.9% over 7 days, a 6.7% decline over 30 days, 11.9% year to date, 16.9% over 1 year, 56.5% over 3 years and 106.0% over 5 years.
-
Recent headlines around Pembina Pipeline have focused on its position in Canadian energy infrastructure and how its asset base fits into long term energy demand, giving investors more context for the recent share price moves. News coverage has also highlighted ongoing interest in income focused energy names, which often draws attention to companies with established assets and regular cash flows.
-
Pembina Pipeline currently has a valuation score of 4 out of 6, based on checks of whether the stock appears undervalued across several methods. The next sections will walk through those approaches before finishing with a way to look beyond the numbers to understand what that valuation really means.
Find out why Pembina Pipeline’s 16.9% return over the last year is lagging behind its peers.
A Discounted Cash Flow model looks at the cash Pembina Pipeline is expected to generate in the future, then discounts those projections back to today to estimate what the business could be worth right now.
Pembina Pipeline last reported trailing twelve month free cash flow of about CA$2.43b. Analysts and extrapolated estimates point to free cash flow of CA$3.54b in 2030, with a series of projected annual figures in between that are used to build a detailed cash flow curve. These projections are based on a 2 Stage Free Cash Flow to Equity model, which combines analyst forecasts for the earlier years with more gradual, modelled growth assumptions further out.
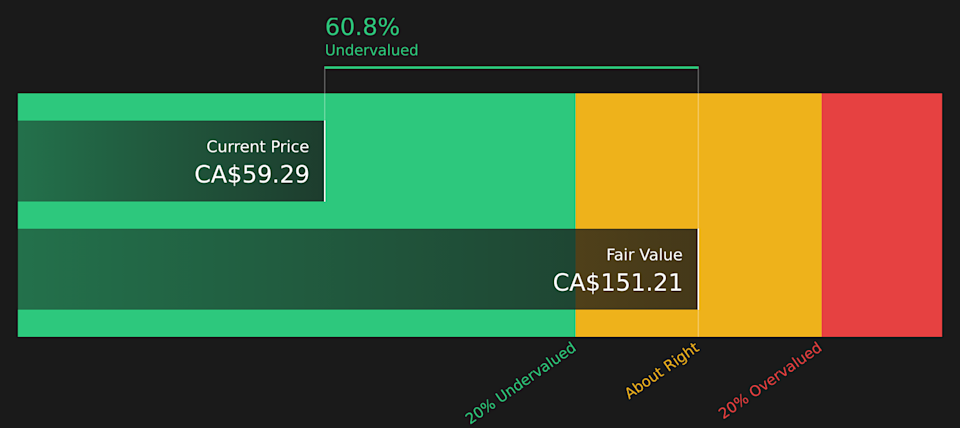
When those cash flows are discounted back and summed, the DCF model suggests an intrinsic value of around CA$151.21 per share. Compared with the recent share price of CA$59.29, this implies the stock is about 60.8% undervalued on this DCF view.
Result: UNDERVALUED
Our Discounted Cash Flow (DCF) analysis suggests Pembina Pipeline is undervalued by 60.8%. Track this in your watchlist or portfolio, or discover 6 more high quality undervalued stocks.
PPL Discounted Cash Flow as at Apr 2026
Head to the Valuation section of our Company Report for more details on how we arrive at this Fair Value for Pembina Pipeline.
For a profitable company like Pembina Pipeline, the P/E ratio is a straightforward way to see how much investors are currently paying for each dollar of earnings. It ties the share price directly to the bottom line, which many investors focus on when judging whether a stock looks expensive or reasonable.
What counts as a “normal” or “fair” P/E will usually reflect what the market expects for future earnings growth and how risky those earnings might be. Higher expected growth or lower perceived risk can justify a higher P/E, while slower growth or higher risk can be associated with a lower P/E.
Pembina Pipeline currently trades on a P/E of 22.24x. That sits very close to the peer average of 22.25x and above the Oil and Gas industry average of 19.69x. Simply Wall St’s Fair Ratio for Pembina Pipeline is 24.27x, which is a proprietary estimate of what the P/E could be given factors like earnings growth, profit margins, industry, market cap and company specific risks.
The Fair Ratio can be more useful than a simple peer or industry comparison because it adjusts for those business characteristics rather than assuming all companies in a sector deserve the same multiple. With the current P/E below the Fair Ratio, this lens points to Pembina Pipeline trading at a discount to that model-based view.
Result: UNDERVALUED
TSX:PPL P/E Ratio as at Apr 2026
P/E ratios tell one story, but what if the real opportunity lies elsewhere? Start investing in legacies, not executives. Discover our 2 top founder-led companies.
Earlier it was mentioned that there is an even better way to understand valuation. On Simply Wall St’s Community page you can use Narratives, where you tell the story you believe about Pembina Pipeline, tie it to specific assumptions for revenue, earnings, margins and a fair value, then see in real time how that fair value compares with the current price and how it shifts when new news or earnings arrive. This is why one investor might build a Narrative around the higher analyst price target of CA$69.00, while another leans on the lower CA$52.00 view, each getting a clear, numbers backed picture of whether the stock looks attractive or not against their own expectations.
Do you think there’s more to the story for Pembina Pipeline? Head over to our Community to see what others are saying!
TSX:PPL 1-Year Stock Price Chart
This article by Simply Wall St is general in nature. We provide commentary based on historical data and analyst forecasts only using an unbiased methodology and our articles are not intended to be financial advice. It does not constitute a recommendation to buy or sell any stock, and does not take account of your objectives, or your financial situation. We aim to bring you long-term focused analysis driven by fundamental data. Note that our analysis may not factor in the latest price-sensitive company announcements or qualitative material. Simply Wall St has no position in any stocks mentioned.
Companies discussed in this article include PPL.TO.
Have feedback on this article? Concerned about the content? Get in touch with us directly. Alternatively, email editorial-team@simplywallst.com

 Pricing Reflect Long Term Energy Infrastructure Role And DCF Signal")