
A total of 156 VOCs were identified across all SSF experiments (Table 1). The compounds were classified according to their functional chemical group resulting in a total of 17 alcohols, 25 aldehydes, 21 esters, 11 furans, 14 ketones, 4 organic acids, 4 phenols, 9 pyrazines, 1 pyridine, 6 pyrroles, 5 sulfur compounds, 28 terpenes, 7 dioxolanes and 4 compounds that did not fit the other groups. When classified by their likely source of origin, there were 29 products typical of lipid oxidation, 41 products associated with Maillard reactions, 32 likely to be derived from PRG, 49 likely to have been produced during SSF, and 5 that did not fit into any of the other groups (Table A1).
Analysis of the semi-quantitative concentration of these compounds in SSF samples revealed the origins of key VOCs that were discussed in prior work25 (Table A3). For example, several VOCs known to occur in BC, such as 2-methylfuran and 2,5-dimethylpyrazine, and in PRG, such as phenylacetaldehyde and dimethyl sulfide, were identified. All fungi generated markers of fungal growth, including 2,3-butanediol, 2-methylpropanol, 2-methylbutanol, 3-methylbutanol and 2-butenal26, as well as compounds typically associated with Maillard reactions, such as 3-methylbutanal, 2-methylbutanal, benzeneacetaldehyde and 2-methylpropanal. Fungi-specific metabolites were also observed, including 2-methylbutanoic acid and 2-methylpropanoic acid by AO, and a diverse set of esters, terpenes and sesquiterpenes by NI and RO. Conversely, several VOCs related to PRG, such as hexanal, dimethyl sulfide, dimethyl disulfide, (Z)-3-hexenal and 1-penten-3-one, decreased in abundance during SSF. Although these results suggest that the odor profile of the substrates would change over SSF time, the principles modeled by Weber-Fechner’s law27 warrant further analysis of the data to understand how and in what magnitude.
Properties of identified volatile organic compounds
The construction of the model required an initial compilation of properties of the VOCs identified. The dimensionless Henry’s volatility constant \({{\rm{H}}}_{{\rm{V}}}^{{\rm{CC}}}\), required to adjust the air-phase measurements to semi-quantitative concentrations in the water solutions (Eq. 3), was readily available for 63 out of 156 VOCs identified from Sander28. The rest were calculated with the EPI suite software with the group and bond contribution methods, estimation models with high accuracy (\({r}^{2}\) > 0.92) based on the chemical structure of the molecules29 (Table A1).
Odor thresholds were found reported for 108 of the identified VOCs, in either air or water. A median was calculated for cases in which multiple reports and/or replicates of the odor thresholds existed. The median statistic was chosen instead of a mean average due to the high variability in the order of magnitude encountered between reports of the same molecules, as evidenced by the odor threshold of benzaldehyde, reported as 3 ppb30, 350 ppb31, and 3500 ppb32 in water solutions. The variability arises from the measurement method used for these thresholds, which depends on the sensory panelists. It is a well-documented issue in the field33,34, caused by various factors such as gender, age, race, and body type, and known to fluctuate between different testing days35.
Alternatively, several predictive models for odor thresholds have been developed, utilizing diverse molecular descriptors. These include models based on physicochemical properties such as polarity, hydrogen bonding capacity, and gas–liquid partitioning (R2 = 0.76)36, quantitative structure–activity relationship (QSAR) approaches using Monte Carlo simulations (R2 > 0.61)37, and models incorporating mass transfer-related properties such as saturation pressure and partition coefficients (R2 = 0.77)38. However, all require data that is not readily available for the same VOCs, which did not have a reported threshold.
The 48 compounds without reported odor thresholds were excluded from the study, as it is not possible to calculate their odor activity values or include them in the mechanistic model without threshold data, making their contribution to odor profiles unverifiable. These included 9 esters produced by NI and RO in both BC + G and BC + W substrates, generally associated with fruity, floral, and ethereal odors, and 11 terpenes and sesquiterpenes, initially considered exclusive to PRG, but found to be synthesized by NI and RO, typically linked to earthy and spice odors. Also excluded were 12 compounds associated with Maillard reactions and 6 related to lipid degradation.
The VOCs included in the analysis had 64 unique odor descriptors related to them. While the mechanistic model was fundamentally capable of predicting an odor intensity (OI) for each of these descriptors, the individual contribution of most of them was insignificant due to the concentration of the VOCs that made of said descriptors being smaller than their odor thresholds (\(C < {C}_{0}\)). The odor descriptors were thus grouped into categories based on their correlation (Table A2), the insights of expert flavorists and the trained sensory panel, resulting in 21 distinct categories: alcohol, baked, citrus, coffee, cooked, dairy, earthy, fermented, floral, fruit, green, herb, miscellaneous, nut, rancid, seaweed, spice, sulfurous, sweet, vegetable, and vinegar (Table A4). The categories coffee, green, floral, fruit, seaweed, and vinegar were mostly made up of descriptors of the same name, as they were either frequent amongst the VOCs or did not fit in the other categories. Categories such as alcohol (ethereal, fusel, rum and alcoholic), dairy (butter, cheese, coconut), earthy (woody, earthy, musk, mushroom, pine and orris) and herb (herbal, cilantro and terpenic), grouped thematically similar descriptors. The category miscellaneous (medicinal and burnt plastic) grouped descriptors that did not fit the other categories.
The most frequent odor categories were fruit (23 VOCs), sweet (18 VOCs), baked (16 VOCs), green (14 VOCs) and rancid (14 VOCs), while the least frequent were seaweed (2 VOCs), sulfurous (2 VOCs), coffee (2 VOCs) and vinegar (1 VOCs). The frequency of categories across the SSF samples was not indicative of their OI, as this was based on the VOCs with the lowest odor thresholds and relatively high abundance.
Mechanistic modeling of odor profiles
Figure 1 shows the overall OI based on the concentration and odor thresholds of VOCs, based on the sum of the OAV of each VOC in each sample with the Weber-Fechner model (Eq. 6), at 0, 24, 48, and 72 h of SSF with AO, NI, and RO in both BC + W and BC + G substrates. In B&W substrates (Fig. 1a), SSF significantly increased the OI over time (p-value < 0.001), with RO and AO achieving the highest overall OI after 48 h. In BC + G substrates (Fig. 1b) Neither fungi nor SSF time had a significant effect on the overall OI (p-value = 0.3). Although 108 VOCs were analyzed, 80 had average OAVs lower than one across all samples, with orders of magnitude ranging from 10-1 to 10-14; thus, their impact on the overall OI was of 0 due to the logarithmic scale. In contrast, the 28 VOCs with OAVs higher than 1, with orders of magnitude ranging from 101 to 105, exerted a predominant influence on the calculations. This implies that these VOCs dominate the volatile stimulus space of the SSF samples and are responsible not only for its overall OI, but also for the impact in each odor category. Similarly, VOCs with unique odor descriptors and low OAVs only had a minimal effect on the model predictions, resulting in a reduced list of relevant odor categories.
 The alternative text for this image may have been generated using AI.
Predicted overall odor intensity based on the concentration of volatile organic compounds at 0, 24, 48 and 72 h of solid-state fermentation (SSF) for Aspergillus oryzae (AO), Neurospora intermedia (NI) and Rhizopus oligosporus (RO) in a bread crusts + water (BC + W) and b bread crusts + perennial ryegrass (BC + G) substrates. Bars represent the mean value (n = 3) and vertical lines the standard error. Data with the same letters in the substrate group are not significantly different (p = 0.05), as determined by Tukey´s HSD post-hoc test.
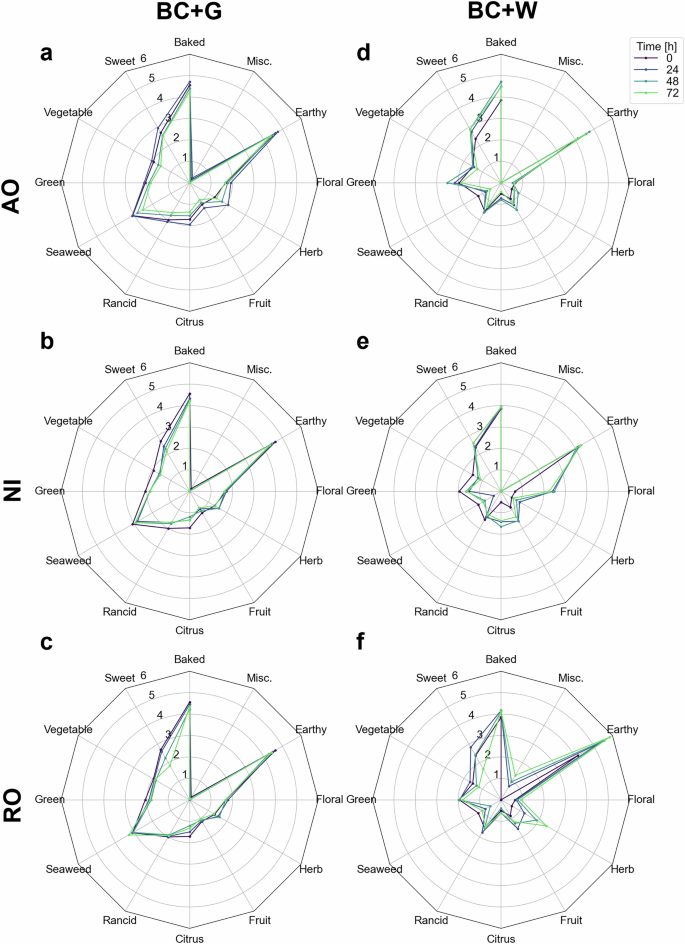
Figure 2 shows the OI of the predicted odor categories (Eq. 8). Of the initial list, categories alcohol, coffee, cooked, dairy, fermented, nut, spice, sulfurous, and vinegar were removed from the study as their OI was close to 0 across all samples. These categories consisted of VOCs whose OAVs were too low to have an impact. For instance, the category coffee was represented by VOCs 2-vinylfuran and 2-acetylfuran and vinegar by acetic acid, all of which were significantly less abundant than their respective odor thresholds. The remaining categories, baked, earthy, floral, herb, fruit, citrus, rancid, seaweed, green, vegetable, sweet, and miscellaneous, had OI between 0 and 6. It is important to note that although common fermentation-related categories such as alcohol and fermented did not contribute meaningfully to the model, the quantitative descriptive analysis (QDA) performed by the trained panel did report a fermented category. This is consistent with the fact that fermented is a broad sensory descriptor, which in practice is made up of a complex combination of other categories (e.g., rancid, sweet, and earthy,). Moreover, the character of fermented differs substantially across substrates and microorganisms, meaning it is not always directly linked to the specific VOCs with the highest OAV in the model.
 The alternative text for this image may have been generated using AI.
Predicted odor profiles based on the concentration of volatile organic compounds at 0, 24, 48, and 72 h of solid-state fermentation (SSF) for Aspergillus oryzae (AO), Neurospora intermedia (NI) and Rhizopus oligosporus (RO) in bread crusts + water (BC + W) and bread crusts + perennial ryegrass (BC + G) substrates. a AO in BC + G. b NI in BC + G. c RO in BC + G. d AO in BC + W. e NI in BC + W. f RO in BC + W. Each data point represents the mean value (n = 3) of the odor intensity in the category on a logarithmic scale.
Across all SSF samples, the categories with the highest OI were baked (ranging from 3.74 to 4.71) and earthy (ranging from 3.94−5.84). Although 16 VOCs shared odor descriptors related to the baked category (bread, biscuit, hops, toasty, etc.), the contribution of 2-ethylfuran, 2-pentylfuran, methylpropanal, 2-methylbutanal, and 3-methylbutanal made up most of the category in all samples. These compounds have been previously reported to be abundant in bread, originating from Maillard reactions7, and were identified in the unfermented samples25. In BC + W SSF (Fig. 2d–f) their abundance increased over time, as noted from the capacity of the fungi to synthesize these compounds25, which translates into an increased OI in the baked category. AO SSF has the highest increase in the category over SSF time due to the relatively higher biosynthesis of 2-pentylfuran, 2-methylbutanal, and 3-methylbutanal, volatiles known to be produced by AO8. In BC + G SSF (Fig. 2a–c) the opposite occurs, and the category is reduced, suggesting different metabolic pathways in the presence of PRG. Moore and Lloyd39 similarly reported that in Aspergillus spp., the VOC profile varied markedly between growth on synthetic media and on corn varieties, with 2-pentylfuran notably absent in the synthetic media. The earthy category was primarily composed of 2-pentylfuran and α-copaene in all samples, and dehydro-β-ionone in the BC + G samples.
There were notable differences between BC + G and BC + W SSF, with only the categories fruit and green not being statistically different (p-value > 0.05). This is attributable to VOCs originating from PRG, which included odor descriptors related to the categories of vegetable, green, seaweed, and rancid. These categories are generally perceived as unpleasant in the context of plant-based foods and AP products. For example, vegetable and green notes have been shown to reduce consumer acceptance of plant-based foods, motivating extensive research into physical, chemical, and biological strategies to mitigate them40. The seaweed odor, related here to marine and fishy descriptors, has previously been linked to sulfurous descriptors in alliaceous foods and can be desirable in seafood and seafood alternatives41, but not in others. Rancid odors, typically arising from lipid degradation, are among the most widespread off-flavors in food42. The most impactful VOCs were hexanal (green), (Z)-3-hexenal (green), (E, E)-2,6-nonadienal (vegetable and rancid), (E, Z)-2,6-nonadienal (vegetable and rancid), dimethyl sulfide (seaweed) and dimethyl disulfide (vegetable), all known VOCs of Lolium sp43. These VOCs were present in all samples, but had higher OAVs in BC + G samples, which decreased over the SSF time.
Additionally, fungi-specific VOCs with OAVs >1 also led to unique changes in odor categories. In the BC + W samples, this had a significant effect (p-value < 0.05) in all categories except for fruit and rancid, while in BC + G samples, a significant effect (p-value < 0.05) in all categories except for fruit, green, herb and floral. This included 2-methylbutanoic acid and 2-hexenyl acetate in AO, 2-octanol, geranyl butyrate and ethyl hexanoate in NI, and α-copaene and caryophyllene in RO. In AO SSF, the sharp increase in 2-methylbutanal and 3-methylbutanal significantly increased the OI of the baked and sweet categories in BC + W. AO also increased the abundance of (E)-2-decenal in BC + G, which increased the OI of the herb category. NI SSF in BC + W had a higher floral OI from the rise in 2-octanol and geranyl butyrate. The impact on this category in NI, and others related to its unique VOCs such as fruit, is likely underestimated, as several other esters were uniquely biosynthesized in NI SSF, but their odor thresholds were not available. RO SSF in BC + W had a higher earthy OI, from the increase of α-copaene and caryophyllene, and a higher herb OI, from increased (E)-2-undecenal. These VOCs led to unique odor profiles for each fungi (Fig. 2), with AO enhancing the characteristic baked and sweet profile of bread, NI developing an ester-rich enhanced floral, fruit, and citrus profile, and RO a terpene-rich enhanced earthy and herb profile.
The pattern observed, where a few volatiles dominate the overall odor profile despite the presence of many others, reflects a common phenomenon observed in most food systems. Dunkel, et al.44 extensively characterized this effect, identifying 226 key food odorants (KFOs), from over 10000 VOCs, in 227 food and beverage samples. Of the 28 VOCs with OAVs >1 in this study, 17 were also in the list of KFOs: dimethyl sulfide, dimethyl disulfide, methylpropanal, 2-methylbutanal, 3-methylbutanal, hexanal, (Z)-3-hexenal, (Z)-4-heptenal, ethyl hexanoate, D-limonene, nonanal, (E)-2-nonenal, (E)-2-decenal, 2-hexenyl acetate, (E,E)-2,6-nonadienal, (E,Z)-2,6-nonadienal and (E)-2-undecenal. Most of these compounds are aldehydes related to Maillard reactions and lipid degradation, making them common in bakery products and cereals7, and have relatively low odor thresholds, ranging from 0.01−10 µg/kg (with a mean value of 8.7 µg/kg), relative to the overall range of 0.01 to 1.25 × 10⁷ µg/kg of all VOCs in the study (with a mean value of 1.25 × 10⁵ µg/kg). The remaining 11 VOCs with OAVs >1 were 2-ethylfuran, 2-pentylfuran, 2-octanol, p-cymene, 2-methylbutyl butanoate, α-copaene, caryophyllene, α-humulene, dehydro-β-ionone, (Z)-nerolidol, and geranyl butyrate. Most of these compounds were related to PRG or synthetized by AO, NI or RO in SSF and thus are not common KFOs identified in other foodstuffs, aside from the furans, which are found in cereals45. Of the 48 compounds that were previously excluded from the analysis due to the lack of odor threshold data, none are found within the list of KFOs, suggesting that most of them would not be odor active as their threshold might otherwise have been reported.
Overall, the model estimates differences in the odor profiles of the samples, which vary with the substrate, the fungus, and the SSF time. Comparing the unfermented substrates (Fig. 2, time 0), it can be observed that the addition of PRG to BC increases the unpleasant vegetable, green, seaweed, and rancid categories, but also the pleasant floral, herb, fruit, and citrus categories, while reducing the characteristic baked category of bread. SSF in the presence of PRG has been shown to slow down fungal growth24, thereby reducing the magnitude of the impact of SSF on the odor profile of the BC + G substrates. Nonetheless, AO and NI reduced the negative odor categories over time, suggesting that fungal SSF can reduce the intensity of unpleasant odors in forage crops. In contrast, SSF in BC + W substrates leads to unique changes in the odor profiles with each fungus, showing the impact of their diverse metabolisms over odor modulation.
Rather than serving as a tool for precise quantitative prediction, the current model is best understood as a means of discerning patterns, beyond simply cataloging the presence or absence of VOCs. A key limitation of the model lies in its treatment of VOC mixtures, as olfactory perception is not a linear summation of individual compound intensities, but rather the result of intricate interactions46. Additionally, human olfaction is highly contextual and influenced by cognitive and environmental factors47. Despite these constraints, the model logically highlights potential KFOs that could be the focus of future research. To evaluate the model’s reliability, a QDA was conducted using a trained sensory panel. This enabled a direct comparison between the predicted and perceived odor profiles of the SSF samples.
Quantitative descriptive analysis (QDA)
Across six training sessions designed to develop a consensus vocabulary, the panel identified a total of 51 unique odor descriptors. These individual descriptors, each reported by between 1 and all 13 panelists, were consolidated into 16 broader odor categories to ensure consistency in analysis (e.g. bread and bread crusts descriptors combined into the cereal category), and the panelists were asked to identify these categories. Several of these categories were not identified by a majority of the group (>7 of the 13 panelists) and were taken out of the study, those were dairy (milk), earthy, woody (wood and hardwood), brown fruit, herb (mixed herbs and oregano), spice (curry, turmeric, pepper and liquorice), sulfurous and vegetable. The final odor categories (Table 2) were cereal (bread, bread crusts, malt, grain, cereal and barley), fermented (soy sauce, musty and silage), rancid (linseed oil), seaweed (nori seaweed), grass (dried grass, hay, green tea, meadow and chamomile), sweet grass (fresh grass), molasses (molasses, treacle, caramel and maple syrup) and malt extract (malt extract, barley extract, marmite and yeast extract). It is important to note that these panel-derived categories were treated as a separate dataset from the mechanistic model to avoid overfitting the data and to provide a transparent comparison that highlights where the model converges and diverges from human perception.
Due to the lack of consensus among panelists regarding the earthy odor category during the training sessions, the attribute was further investigated. To explore this, a supplementary blind smell trial was conducted using five chemical standards commonly associated with earthy and moldy odors: 2-nonenal, geosmin, 2,4,6-trichloroanisole, 2,6-dichlorophenol, 2-isopropyl-3-methoxypyrazine, and 2-methylisoborneol. Interestingly, panelists rarely used earthy descriptors to describe these standards; instead, they identified them with terms such as “moldy,” “chemical,” and “leathery.” These findings suggest that descriptors related to the fermented odor category may have been used more frequently by panelists to capture earth-like qualities, which are known to be adjacent sensory perceptions48, particularly in BC + G samples.
Figure 3 shows the resulting scores of the QDA. MANOVA was performed after splitting the data by substrate, as the profiles were significantly different and overshadowed the statistical effect of the other variables SSF time and fungi (Table A5). This was mainly driven by the concentration of all VOCs originating from PRG (Table A3), mainly terpenes such as β-cyclocitral and β-cyclohomocitral, and aldehydes related to lipid degradation such as (E)-2-pentenal and (E)-2-undecenal, which were not present in BC + W substrates. Preliminary statistical tests with unsplit data (data not shown) yielded significant effects (p-value < 0.05) for all variables, overestimating the effect of SSF in BC + G substrates. In BC + W substrates (Fig. 3d–f), both the fungus and SSF time had a significant effect on the odor profiles (p-value < 0.001), and a significant interaction effect between these variables was identified (p-value = 0.035). Comparing the fermented substrates to those at time 0, SSF increased the intensity of the cereal, malt extract, molasses, and fermented categories. AO and RO SSF achieved the highest increase, while NI didn’t affect the substrate as significantly. The positive effect of SSF over the odor profile had a maximum at 48 h of SSF, as after 72 h the intensity of the cereal, malt extract and molasses categories were significantly lower (p-value < 0.05). Comparable trends have been observed in traditional SSF applications. For example, soybean fermentation with RO to produce tempeh is typically limited to 40–50 h, since prolonged incubation results in mycelial senescence, lipid oxidation, and the accumulation of bitter-tasting amino acids that compromise sensory quality49. Similarly, the fermentation of peanut press cake, okara, and tapioca waste with NI to produce red oncom is generally restricted to 24–48 h, as longer times cause physical compaction of the substrate and the development of bitter notes13.
 The alternative text for this image may have been generated using AI.
Odor profiles from trained sensory panels at 0, 24, 48, and 72 h of solid-state fermentation (SSF) for Aspergillus oryzae (AO), Neurospora intermedia (NI), and Rhizopus oligosporus (RO) in bread crusts + water (BC + W) and bread crusts + perennial ryegrass (BC + G) substrates a AO in BC + G. b NI in BC + G. c RO in BC + G. d AO in BC + W. e NI in BC + W. f RO in BC + W. Scores in each category represent the mean value (n = 13).
In BC + G substrates (Fig. 3a, b, and c), neither the fungus nor SSF time had a significant effect on the odor profiles (p-value > 0.05), but a significant interaction effect between these variables was identified (p-value = 0.034). AO and NI SSF decreased the intensity of the rancid, seaweed, grass, and sweet grass categories over time, with AO achieving the highest impact after 72 h and NI after 48 h. These findings also have practical implications for optimizing AP production. Previous work showed that crude protein content reaches its maximum after 48 h for RO, but only after 72 h for AO and NI25. In BC + W, this aligns with the point of maximum positive sensory impact, suggesting that RO SSF can be stopped at 48 h to achieve both an optimal odor profile and increased protein content without loss of yield. For AO and NI, however, it remains to be determined whether extending fermentation to 72 h provides sufficient sensory benefit to justify the longer processing time, or if 48 h represents the most efficient compromise. As each species generates different odor profiles, there is no single “optimal” fungus; rather, each species offers different trade-offs between protein enrichment and odor development, making them suitable for different applications.
The presence of PRG protein in the BC substrate masked the cereal, malt extract, and molasses categories from the BC + G substrates (Fig. 3a–c), underpinning the masking effect of certain VOCs and their impact on human perception50. Fermented was the only category present in all samples, primarily associated with the same musty and moldy descriptors in both substrates. Only NI SSF resulted in the crossover of the odor categories between BC + W and BC + G substrates, being capable of surpassing the masking effect of PRG.
Comparison of predicted and measured odor profiles
Analysis of the odor profiles predicted by the model and scored by the sensory panel reveals statistically supported relationships, alongside the model’s strengths and weaknesses. Figure 4 shows a significant positive correlation (R = 0.776, R2 = 0.603, p-value < 0.001) between the logarithmic predicted overall OI of the model and the perceived overall OI of the QDA. The fit illustrates the scale of the model, where a 4.2 to 5.1 range in the logarithmic scale is contrasted with a 25−55 scale by a trained panel. This trend serves as a validation of the Weber-Fechner law regarding the non-linear behavior of human smell, as shown previously in other applications20. The values for unfermented BC + W stand out as an outlier in the regression as the lowest OI (panel score of 25). This could have been due to the relatively higher intensity of every other sample, either with PRG and/or fermented, which would affect the intensity perception47.
 The alternative text for this image may have been generated using AI.
Predicted overall odor intensity versus perceived overall odor intensity by trained sensory panelists for all samples of solid-state fermentation (SSF) with Aspergillus oryzae (AO), Neurospora intermedia (NI) and Rhizopus oligosporus (RO) in bread crusts + water (BC + W) and bread crusts + perennial ryegrass (BC + G) substrates. Points represent the mean value of both variables, and lines represent a standard error (n = 3 for the model data and n = 13 for the panel data).
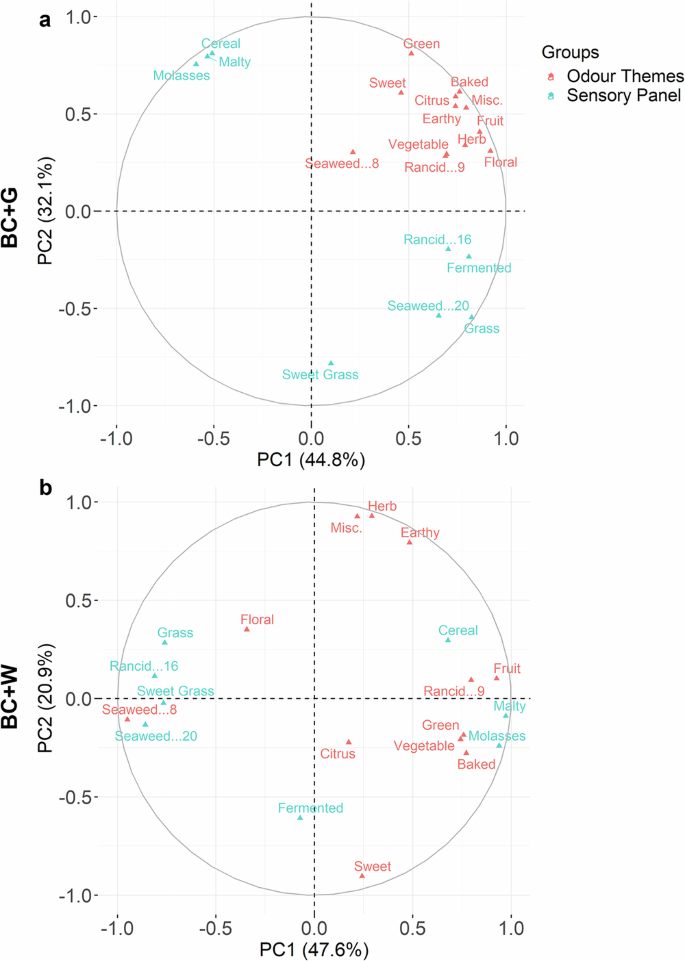
Figure 5 shows the variable scores of the multifactor analysis (MFA). This data enables the comparison of the predicted and perceived odor profiles by analyzing the proximity of the odor categories between the two datasets. The first two principal components (PC1 and PC2) of the MFA explain 76.9% of the variation in BC + G substrates (Fig. 5a) and 68.5% in BC + W substrates (Fig. 5b).
 The alternative text for this image may have been generated using AI.
Variable scores of the multiple factor analysis (MFA) of the predicted odor profiles (odor categories, in red) and the identified odor profiles from trained sensory panel (sensory panel odor categories, in blue) for samples of solid-state fermentation (SSF) with Aspergillus oryzae (AO), Neurospora intermedia (NI) and Rhizopus oligosporus (RO) in a bread crusts + perennial ryegrass (BC + G) substrates and b bread crusts + water (BC + W).
In the BC + G samples (Fig. 5a), the alignment between predicted and perceived odor profiles is limited. All the predicted odor categories cluster tightly in the upper-right quadrant (PC1 + , PC2 + ). In contrast, the QDA data exhibits a split distribution, with grass and SSF-related categories located in PC1+ and BC-related categories in PC1-. This suggests that PC1 captures the contrast between grassy and baked/sweet odors exclusively from the QDA results, and ultimately that the model incorrectly predicts the intensity of BC-related odors in the presence of PRG.
In the BC + W samples (Fig. 5b), the connection between the predicted and perceived odor profiles is notably improved compared to BC + G. In PC1-, QDA categories such as grass, sweet grass, rancid, and seaweed closely align with the model’s predicted seaweed and floral category, driven mainly by the concentration of dimethyl sulfide and geranyl butyrate in NI SSF, which are the main BC + W samples where these categories were affected. Other unpleasant categories such as green, rancid and vegetable are opposite to this group due to the presence of related descriptors in VOCs common across all samples, regardless of PRG. Particularly, lipid degradation compounds such as nonanal, (Z)-4-heptenal, (E)-2-pentenal, (E,E)-2,6-Nonadienal, 2-hexenal, 3-hexenal and hexanal, are ubiquitous to all samples. In PC1 + , QDA BC-related categories, such as malty, cereal, and molasses, align with the model’s baked and fruit categories, driven mainly by the aldehydes identified as KFOs. PC2 captures the effect of specific fungi over the model’s predictions, which were not identified by the QDA, such as the changes in the sweet category by AO and RO SSF, and the changes in the herb and earthy category by RO SSF.
In terms of the predicted (Fig. 2) and QDA (Fig. 3) profiles, the most notable common trend in BC + G was the reduction in the intensity of the PRG-related odors throughout SSF. Both the model’s predictions (seaweed, green, vegetable, and rancid) and the QDA results (sweet grass, grass, seaweed, and rancid) showed a reduction over time. In BC + W, changes in the predicted baked and sweet categories were also seen in the QDA through increased intensities in cereal, malt extract, and molasses, with AO SSF achieving the highest intensities. Some predicted odor categories that were not explicitly included in the QDA vocabulary may still have influenced the perceived profiles. For example, while NI SSF was not predicted to exhibit stronger sweet notes, it was predicted to have an increased fruit intensity, which the panelists might have perceived within the molasses category, as fruity notes exist within the same sensory dimension51. Similarly, the predicted increase in floral intensity could also explain the heightened sweet grass and grass intensities observed in the QDA. In the case of RO SSF, the predicted increase in herb intensity may correspond to the grass notes perceived by the panel. In all SSF, the increase in the QDA category fermented could not be directly compared with any single category in the model; however, it may be related to the concurrent increases in predicted earthy, vegetable, herb, and green categories, which together could synergistically contribute to the overall perception of fermented. Additionally, other compounds with relevant odors in the molasses category might not have been identified within our experiments but could be an important part of the profile, such as the hydroxyfuranones sotolon, furaneol and homofuraneol, which are polar sugar degradation compounds formed from Maillard reactions52.
Limitations and future work
While the modeling exercise enabled comparisons between model predictions and QDA results and allowed the identification of KFOs with potential for further exploration, several limitations need to be addressed. Importantly, modeling should be seen as an iterative process, and this work represents an initial step toward developing a novel mechanistic framework.
The selection of the Weber-Fechner law as the model for this model was based on its simplicity and previous successful approximations to mathematically measure the odor intensity of mixtures based on their chemical composition18,27. Other models, such as Stevens’ power law19, have been shown to better fit odor intensity data20, but due to the lack of available literature on either Weber-Fechner coefficients (\({\rm{a}}\)) or Steven’s power law index (\({\rm{n}}\)) for most VOCs identified in this study, it was deemed more appropriate to simplify Weber-Fechner law’s with \({\rm{a}}=1\) as the slope for all VOCs. Future work should address the measurement of these parameters, as it would increase the accuracy of the predicted models. Additionally, odor thresholds should be measured whenever possible within comparable conditions for all VOCs, or at least the most impactful KFOs, as the identified variance in the literature data, and the error added to the model by transforming thresholds measured in other mediums (e.g., air, alcohols and oils) negatively impacts the accuracy of the model27.
The model did not incorporate chemical interactions between VOCs, thus not considering potential synergistic and antagonistic effects, which was particularly significant in the presence of PRG, nor perceptual effects in mixtures such as suppression and configural perception. The complexity of these effects has been reported in binary53 and tertiary mixtures54, and modeled through machine learning models that incorporate hardcoded constraints from expert flavorists55,56,57. Expanding these interactions into real food systems with hundreds of VOCs remains a daunting task, as the mechanistic rules that govern these interactions are poorly understood. Future work should combine machine learning methods with mechanistic modeling to incorporate both psychophysical and fuzzy logic constraints.
The categorization of odor descriptors and categories was based on correlation analysis and expert input, but the use of 1% ethanol solutions on strips to define descriptors imposed limitations. Ideally, descriptors should be derived from authentic compounds assessed at their odor threshold concentrations, in contextually relevant substrates, to avoid biases introduced by concentration effects or matrix effects. Additionally, broad descriptors such as “fermented” risk masking underlying differences in perception, and future panels should be designed to separate these into more specific attributes.
The semi-quantitative nature of SPME GC–MS introduced significant variability in measured VOC concentrations. This could be improved by employing calibration curves for individual compounds (particularly KFOs), labeled standards dosed into a suitable bland matrix and complementary columns (e.g., DB-5 with polar columns). Molecular sensory science techniques, such as GC–O, should also be integrated to strengthen the link between detected VOCs and odor perception.
While the trained sensory panel provided essential validation, variability is inherent to sensory data58 and could have been reduced by tailoring training more specifically to broad descriptors (e.g., “fermented”), which were found to be contrasting with the mechanistic model after the panel had been completed, or by separating contrasting substrates (e.g., BC + W vs BC + G). Future studies may benefit from applying the approach to simpler food matrices, such as wine or yogurt, where extensive comparative datasets of VOCs and KFOs exist. This would reduce complexity and improve the precision of the mechanistic model.
Overall, this research demonstrates the potential of a mechanistic psychophysical model to predict trends in the odor intensity and odor profile of foodstuffs. The methodology enables the semi-quantitative identification of KFOs, allowing patterns in the data to be recognized and providing insights into the main contributors to an odor profile. While the model shows statistically supported correlations with trained sensory panels, its predictive accuracy is limited by several factors. These include the omission of synergistic and antagonistic interactions among VOCs, the need for more precise quantification methods, the lack of complete odor threshold data and refined modeling coefficients, and the inherent complexity of the substrates studied. Future work addressing these limitations, particularly by applying the model to simpler food matrices, could substantially improve its robustness. Ultimately, mechanistic models such as this offer an interpretable foundation that can be further developed and potentially integrated with advanced computational approaches to support food formulation and process optimization.
From a biological perspective, the KFOs synthesized during SSF are likely to drive odor profile shifts in the final products. In most cases, the production or consumption of these compounds aligned with observed sensory changes; however, specific fungal effects, such as the elevated fruity intensity of NI or the earthy intensity of RO, could not be fully reconciled with the panel data. These findings highlight the need for further investigation, particularly into substrate-specific effects such as those arising from PRG. The identification of fungi-specific KFOs also provides a rational basis for selecting microbial strains tailored to desired odor outcomes in food applications.