
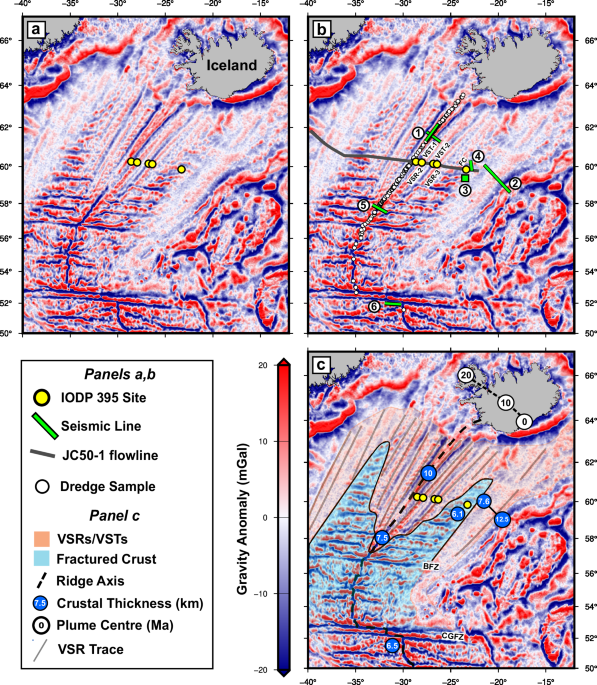
IODP drilling operations, site descriptions and sample descriptions can be found in the Proceedings of IODP Expedition 39511. Whole-rock and glass basalt samples were taken from five principal drill holes (U1555I, U1563B, U1554F, U1562B and U1564F). The first four sites were drilled during IODP Expedition 395C in 2021. Site U1564F was drilled during Expedition 395 in 2023. Samples were selected to avoid alteration and span the complete depth range of basalt recovery within each hole. Each hole cored through over 100 m of basement, with a recovery ranging from 43 to 66%.
Major and trace element analysis of whole-rock
Whole-rock sample preparation was carried out at the University of Cambridge, UK. Fresh unaltered samples were cut into ~5 cm pieces and dried prior to crushing using a steel jaw crusher and powdering in an agate ball mill. Sample powders were then divided for XRF and ICP-MS analysis. Here, we present whole-rock major and trace element data for hole U1564F at Site FC only, which supplements limited glass availability (see ‘Major and trace element analysis of basalt glass’).
Major element (and selected trace element) concentrations of whole-rock samples were measured using a Philips PW2404 wavelength-dispersive sequential X-ray fluorescence spectrometer (XRF) at the University of Edinburgh. These measurements are not directly exploited in this study but are provided for reference purposes in the Source Data file. A detailed description of the sample preparation procedures is provided by Passmore et al.52. Fused glass discs and pressed pellets were prepared from powdered samples. Major and trace elements were analysed using fused glass discs and pressed pellets, respectively, following the analytical procedures of Fitton et al.53.
Accuracy and precision of XRF analysis were determined by repeat measurements of USGS international standard materials BIR-1 and BE-N. In both cases, the accuracy of major element measurements is better than 1%, with the exception of Na2O, which has an accuracy of ≤5%. Precision is typically better than 1%. These data are consistent with previously published XRF analyses on basaltic samples52.
For ICP-MS analysis, 0.1 g of powder was digested in concentrated HF-HNO3 overnight on a 115 ∘C hot block. Fluorides were redissolved with concentrated HNO3 and MilliQ H2O, before dilution to 50 ml. All samples were analysed on a Perkin Elmer Nexion 350D ICP-MS at the University of Cambridge, UK. Calibration standards were BIR-1, BHVO-2 and BCR-2. Internal standards were 10 ppb Rh, In and Re, and each sample was prepared in 1% HNO3. Instrumental drift was less than 10%. ICP-MS sensitivity was 5 × 10⁵ cps/ppb In, with CeO/Ce ratios approximately 2%. Raw intensities were blank-subtracted and internal standard normalised before calibration calculations were performed. REE element signal intensities were corrected for any oxide overlaps using correction factors that had been previously generated.
Accuracy and precision of ICP-MS measurements were monitored by repeat measurements of external USGS reference materials BCR-2, BHVO-2 and BIR-1 throughout the analytical sessions. Across all standards, the accuracy of REE measurements was better than 3% and typically better than 2%. Precision was also better than 3%. Full accuracy and precision statistics of standard analyses are provided in the Source Data file.
Major and trace element analysis of basalt glass
Glass chips of size 1–2 mm were picked from crushes of selected samples. The glass chips were cleaned with MilliQ H2O and inspected with a reflected light microscope to avoid microlites. Three to five chips per sample were set into epoxy resin mounts.
For major element analysis, a Cameca SX100 EPMA at the University of Cambridge was used. Major element oxides were measured using five wavelength-dispersive spectrometers with counting times on elements ranging from 10 to 60 s. Beam conditions of 15 kV accelerating voltage, 10 nA, and a spot size of 10 μm were employed. Up to 25 total analyses per sample were completed (5 spots across up to 5 chips, depending on chip quality/availability). The accuracy and precision of measurements were monitored by regular measurement of external standard glasses VG-2 and NMNH 113716-1 from the Smithsonian Museum of Natural History. Accuracy for all major element oxides of VG-2 was ≤5% and was better than 2% for MgO and FeO, which are the only major element oxides used in this study. Accuracy for NMNH 113716-1 was ≤5% for all major element oxides except for Na2O and P2O5. Accuracy was ≤3.5% for SiO2, MgO and FeO. Precision for both standards was ≤3% (1 standard deviation) for all elements not close to the detection limit. Significant analytical drift was not observed. Overall, this performance is comparable with other published studies that analysed these standards (see Source Data) as well as with studies employing EPMA for natural glasses52. It was deemed adequate for the purposes of our study. Uncertainty is not provided for these reference standard values. However, variations in reported values from a number of published studies are ≤3% for VG-2 and up to 7% for NMNH 113716-1. In particular, studies repeatedly report Na2O values for NMNH 113716-1 that are more than 5% higher than the accepted value (see Source Data).
Major element data that have been corrected against the accepted composition of VG-2 are also provided in the Source Data file, together with the factors applied for correction. This correction improves the accuracy of major element oxides for the NMNH 113716-1 standard to ≤2% for all measurements above 0.5 wt% with the exception of Na2O, which, as stated above, does not have a reliable accepted concentration. This correction procedure follows the method of Helz54 and is similar to the inter-laboratory bias corrections applied by Gale et al.15 for the VG-2 glass standard.
Glass chips were included in the sample mean if the standard deviations across the chips for selected major element oxides did not exceed specified thresholds (i.e. Na2O < 0.1, Al2O3 < 1, SiO2 < 0.5, CaO < 0.5, MgO < 0.5 and total oxides < 1.5 wt%). Variation between chips of other major element oxides was manually inspected after filtering to ensure that clean glass had been targeted. The number of chips for each sample that passed filtering conditions is included in the Source Data file, in addition to the average standard deviation of oxides across each chip and the chips included in the sample mean. Raw data are also provided to enable readers to apply their own filtering conditions.
For trace element analysis, an ESI NWR193 laser system coupled to a Perkin Elmer Nexion 350D Inductively Coupled Plasma Mass Spectrometer (LA-ICP-MS) at the University of Cambridge was employed. This technique requires a 50 μm diameter laser beam, a laser repetition rate of 20 Hz and a laser fluence of 4 J/cm2 in order to ensure optimum signal intensity while minimising downhole fractionation. LA-ICP-MS data acquisition settings were 1 sweep per reading, 80 readings, 1 replicate and total data acquisition lasted 60 seconds (i.e. approximately 1 data point for each element per second) with a laser warm-up time of 20 s for each spot analysis. The ICP-MS dwell time for each mass was dependent upon the isotope and concentration of the element in the samples, but was typically 20–40 ms for trace elements.
Up to 15 individual analyses were carried out per sample (3 spots across up to 5 chips, depending upon chip quality/availability). At least 8 samples were analysed per drill hole, covering the full depth interval with the exception of hole U1564F, where only two glass samples were of sufficient quality to obtain reliable data. The GLITTER (v4.5) software package55, developed by GEMOC (https://www.glitter.mq.edu.au), was used for data reduction, including background subtraction, drift correction and external calibrations. Several external glass reference samples were also analysed to ensure data quality, including NIST-610, NIST-612, NIST-614, BIR-1G, BCR-2G and BHVO-2G. The external calibration standard was BHVO-2G. Both NIST-612 and BHVO-2G were evaluated as calibration standards, but BHVO-2G was preferred for the matrix-matching composition. LA-ICP-MS raw intensity drift during an analytical session of 8 hours is typically less than 10%, based upon raw counts for NIST standards and compensated for by the internal standard calculations in the GLITTER Software; no other drift corrections are used. Silica concentration for BHVO-2G from the GeoReM database was employed as the normalising internal standard.
Accuracy and precision of LA-ICP-MS analysis were monitored by repeat measurements of external reference samples BIR-1G and BCR-2G. Accuracy for BIR-1G is ≤5% for most trace elements and for all REEs, which are the primary focus of this study. Accuracy for BCR-2G for REEs is ≤5%, except for Ce, which is 6%. Most REEs on both standards have an accuracy ≤3%. Precision of trace element analyses was variable but better than 10 % for most REEs and trace elements of sufficient concentration above the detection limit. Details of the accuracy and precision of these standards are provided in Source Data.
Glass chips were included in the sample mean if the standard deviations across chips for selected trace elements did not exceed specified thresholds (i.e. La < 0.5, Ce < 0.9, Nd < 1 and Pb < 0.5, Li < 0.6 and Sr < 9 ppm). Variation of other trace elements between chips was manually inspected after filtering to ensure that clean glass had been targeted. The number of chips for each sample that passed filtering is included in the Source Data file, in addition to the average standard deviation of trace elements across each chip and the chips included in the sample mean. Raw data are also provided to enable readers to apply their preferred filtering conditions.
SiO2 concentrations of glass chips measured by EPMA are used to normalise the trace element data measured by LA-ICP-MS. This correction is proportional, such that a 1% error in SiO2 yields a 1% error in trace element concentration. EPMA analysis achieved an uncorrected accuracy of < 2%, and therefore, the propagated uncertainty in trace elements is < 2%. This uncertainty is typically smaller than the LA-ICP-MS measurement uncertainty. Trace element data calculated using raw SiO2 concentrations, as well as trace element data calculated using SiO2 concentrations corrected on the VG-2 glass standard, are provided in the Source Data file. The principal component analysis and modelling results presented in this study exploit the corrected trace element data. However, identical analysis using uncorrected measurements yields almost identical conclusions. For example, using uncorrected glass measurements from Site FC yields an optimal mantle potential temperature that is only 3 ∘C higher, which is within the accepted temperature range used to match observations.
Nd radiogenic isotope (143Nd/144Nd) analyses
Weighed whole-rock sample powders were dried at 95 ∘C before redissolving for ion exchange chromatography. Nd was purified from these samples using a two-stage column procedure: Eichrom TRU spec columns isolated the REE fraction, before Eichrom Ln spec columns purified Nd. Samples were aliquoted and diluted with 2% HNO3 to equal Nd concentrations for measurement. 143Nd/144Nd ratios were then determined on a Thermo Scientific NEPTUNE Plus multi-collector ICP-MS. Sample preparation and measurement for samples from holes U1555I, U1563B, U1554F and U1562B (VST-1–VSR-3) were carried out during July-August 2023. Sample preparation and measurement for site U1564F (FC) were carried out during October–December 2024.
In 2023, the JNdi-1 (20 ppb) Nd bracketing standard was determined at 143Nd/144Nd of 0.512001 ± 8 (2 s.d., n = 16), and all data are normalised to JNdi-1 143Nd/144Nd of 0.51211556. To ensure reproducibility of the radiogenic isotope ratio analyses, USGS rock reference materials BCR-2 and BHVO-2 were taken from powders to Nd fraction and analysed simultaneously with the samples. These standards were measured with 143Nd/144Nd of 0.512641 ± 13 (2 s.d., n = 4) for BCR-2 and 143Nd/144Nd of 0.512993 ± 15 (2 s.d., n = 4) for BHVO-2. These measurements compare to accepted GeoReM values of 0.512635 ± 29 (1 s.d.) and of 0.512979 ± 14 (1 s.d.) for BCR-2 and BHVO-2, respectively, implying good external reproducibility. All procedural blanks contained negligible Nd.
In 2024, the JNdi-1 (20 ppb) Nd bracketing standard was determined at 143Nd/144Nd of 0.512117 ± 2 (2 s.d., n = 15), and all data are normalised to JNdi-1 143Nd/144Nd of 0.51211556. BCR-2 and BHVO-2 USGS standards were measured with 143Nd/144Nd of 0.512633 ± 7 (n = 3) for BCR-2 and 143Nd/144Nd of 0.512985 ± 4 (n = 2) for BHVO-2. All procedural blanks and blanks that had undergone column chemistry contained negligible Nd. Five samples (including a USGS standard) from the 2023 run were reanalysed in the 2024 run. These samples recorded equivalent results within measurement error. In addition, two samples from the 2023 run were reprocessed through the entire chemistry. These samples returned the same results within measurement error as in 2023.
Basalts from hole U1564F are extensively altered11. Sea-water alteration has a negligible effect upon the 143Nd/144Nd of oceanic basalts57. However, for verification, acid pre-leaching was carried out on a second batch of U1564F samples prior to digestion and column chemistry. Acid leaching followed the procedure of Weis et al.57. Two leached residues were taken for column chemistry and 143Nd/144Nd analyses. Measured 143Nd/144Nd ratios for leached and un-leached basalt powders were equivalent within measurement error, suggesting Nd isotopes are unaffected by even severe alteration.
A minor age correction was applied to all isotopic measurements. For that sample closest to the sediment/basement interface, age is constrained by a magnetic anomaly, which is then verified using palaeotological biomarkers at the base of the sediment pile. The ages are 2.8 Ma for U1555I, 5.2 Ma for U1562B, 12.7 Ma for U1554F, 13.9 Ma for U1562B, and 32.4 Ma for U1564F. In this study, it is assumed that there is no significant age variation within the basalt drilled section. Due to the long-half life of the Sm-Nd decay system, small variations in down-hole age will not quantitatively affect the results.
Principal component analysis
REE measurements from all sites were combined with previously published datasets from axial dredges. The compiled studies consist of Gale et al.15, Murton et al.16 and Jones et al.17. Duplicate analyses were removed. Dredge samples less than 60 km south of the southern transform fault of the CGFZ were removed to mitigate the effects of thermal cooling caused by the presence of the transform fault25. Data sources are provided in Source Data. Dredge materials have inherently greater spatial uncertainty compared to ocean drilling. This uncertainty is partly addressed by the high axial sample density combined with the fact that axial geochemical trends in trace element and radiogenic isotope composition are well characterised15,16,17,30.
Whole-rock samples from Site FC were filtered for plagioclase accumulation since large phenocrysts were observed in some thin sections11. Sr/Y is an appropriate proxy for determining the extent of plagioclase crystal accumulation because Sr is highly compatible in anorthitic plagioclase compared with Y58. Plagioclase accumulation is also expected to elevate Al2O3 content and may generate an Eu anomaly. PCA was carried out on whole-rock samples from Site FC using the method as described below. P2 was found to dominantly reflect plagioclase accumulation with correlated loadings on Sr, Al2O3 and Eu. Whole-rock measurements were removed if Sr/Y > 3.2 (glass average = 2.7), which correlates with Al2O3 and generally gives a P2 score elevated with respect to the glass samples.
The combined REE dataset was normalised by subtracting the mean and dividing by the standard deviation for each element. Samples for which all REEs were not reported were omitted. PCA was implemented using the decomposition module and PCA algorithm in Scikit-learn (v1.5.1). Elemental loadings were calculated from the component matrix calculated, and principal component scores were computed using matrix multiplication of the normalised data with the loading matrix. PCA element loadings and principal component scores are provided in the Source Data file.
The effect of melt degree and fractional crystallisation was projected into PCA space with the aid of the pyMelt library (Fig. 2c). To examine the effect of temperature anomalies, a forward-modelled composition and parameterisation based upon the glass composition at Site FC was created, and mantle potential temperature was incrementally increased. To examine the effect of fractional crystallisation, a forward-modelled composition and parameterisation that represents the central cluster of samples within the Icelandic chemical gradient was created, and olivine was crystallised out using an in-built pyMelt function. Both processes largely resulted in uniform enrichment/depletion of REE concentrations. The calculated melt compositions were then analysed using PCA and found to plot predominantly along the trajectory of the Gd loading vector. To improve interpretability and to ensure these processes resulted in a horizontal array, all PC scores and loadings were rotated to align the Gd vector with the positive horizontal axis. These rotated axes are referred to as P1r and P2r.
Geochemical modelling
First, measured REE concentrations are corrected for crystallisation of olivine, following the method of Tatsumi (1983)59. We assume a Fo number of olivine that is in equilibrium with the mantle of 9060, a Kd (Fe/Mg) = 0.361, and a constant ratio Fe3+/∑Fe = 0.15, consistent with values from the Reykjanes Ridge62. In this way, we calculate the amount of olivine that would need to be added to the basalt liquid composition until olivine, which is in equilibrium with the rock, reaches an Fo of 90. We then calculate the original trace element concentration of the magma by diluting it in proportion to the volume of added olivine. Samples from all sites are corrected in this way to enable quantitative inter-site comparison.
pyMelt (v2.3) was used for REE forward modelling. We parametrised the mantle source using a combination of the hydrous lherzolite lithology of Katz et al.39 and silica-undersaturated KG-1 pyroxenite. The trace element composition of the lherzolite was at first assigned that of Workman and Hart40. For VSR/VST sites, it was not possible to obtain acceptable fits using this source composition (Fig. 5). Therefore, a revised mantle source composition was calculated by calibration, which provides a closer approximation to the depleted component of the Iceland plume.
This source was obtained by matching both the observed REE composition of dredge samples where VSR-1 intersects the mid-ocean ridge and the observed crustal thickness of 8.6 km at this location (White et al.19). The composition of this calculated mantle source is provided in the Source Data file. The trace element composition of KG-1 was produced by mixing depleted mantle (Workman and Hart40) and subducted oceanic crust (Stracke et al.63) in a 1:1 ratio64. Partition coefficients of Gibson and Geist65, were assumed. Mineralogy of the lherzolite was specified as defined for spinel peridotite by McKenzie and O’Nions38, and for the pyroxenite as defined for KG-1 by Matthews et al.37. Exhaustion of clinopyroxene during melting was set at 15%. The pyMelt default parameterisation of the garnet-spinel mineral transition was used, including a linear function in temperature-pressure space with a gradient of 1/666.7 and an intercept pressure of 400/666.7 for garnet-out, and 1/666.7 and 533/666.7 for spinel-in38. The spinel-garnet transition was translated to a lower pressure for pyroxenite melting to account for greater garnet stability.
The isotopic composition of the homogenised melt was calculated by applying a simple binary mixing model between the lherzolite and pyroxenite melts (Supplementary Fig. 1). The Nd isotope ratio of the individual melts is inherited from the isotopic composition of the mantle sources. A range of 143Nd/144Nd contents for pyroxenite and for the enriched Icelandic end-member exist (e.g. 0.512733, ≤0.512834 or 0.512932). The value used in this study is 0.5127. A higher value of 0.513156 (εNd = 10.1) was picked for the lherzolite component, which matches the isotopic composition of Reykjanes Ridge dredges south of 61.2∘N. This value is similar to the value of 0.51320 used for the peridotite end-member by Koornneef et al.33. It is also similar to the value of 0.51313 estimated for average DMM by Workman and Hart40.
For each site, the lithological contribution of pyroxenite and lherzolite components was calculated using pyMelt. Mantle proportions were varied to ensure that lithological contributions from pyroxenite matched the proportion required by the simple isotopic mixing model (Supplementary Fig. 1). Crustal thickness was calculated within pyMelt by finding the depth at which the pressure of produced overlying melt of crustal density (2.9 g/cm3) is equal to the pressure of melting. The base of the crust was taken as the top of the melting column. Instantaneous fractional melts produced beneath this depth were integrated assuming a triangular melting regime for each lithology. The trace element composition of the erupted melt is then calculated by homogenising the pyroxenite- and lherzolite-derived melts, weighted by the relative contribution of each lithology to the pooled melt/igneous crust. Mantle water content was set at 0.01 wt% for Site FC, consistent with reference estimations for DMM66. For the axial VST-1, VST-1, VSR-2 and VSR-3, water content was set at 0.015, 0.016, 0.016 and 0.014 wt%, respectively. These values were chosen using H2O/Ce values that match axial dredge samples with similar degrees of mantle enrichment (εNd).
Testing model parameters
We carried out temperature sensitivity analysis by varying the potential temperature on either side of the optimal value. In this way, a range of temperatures that reflects measurement uncertainty was obtained (Fig. 4). Significantly, the range of temperatures for Site FC does not overlap those of the VSR/VST sites. Geochemical modelling is dependent upon the estimated melt productivity of the mantle source for a given mantle potential temperature. Melt productivity is dependent upon the choice of mantle source parameterisation together with the mantle water content. The latter was found to have a very minor effect on melt generation and melt composition: trebling water content for melting hydrous lherzolite from 0.01 wt% to 0.03 wt% increases the predicted crustal thickness by 0.2 km where forward-modelled light REE concentrations are still matched within the degree of uncertainty.
The conclusions of this study depend upon the relative difference in the depth and degree of melting calculated for different sites. It is therefore important to assume a self-consistent set of assumptions regarding mantle source parameterisation and mineralogy. Uniform changes to these assumptions do not affect the relative differences and the conclusions that we make. As a test, we changed the lherzolite melting parameterisation to that constructed by Ball et al.67. Their lherzolite parameterisation generates less overall melt for a given mantle potential temperature compared to Katz et al.39, yielding a more REE-enriched aggregated melt composition. At Site FC, this model test required a mantle potential temperature of 1322 ± 15 ∘C, which is, within the range of petrological uncertainty, essentially the ambient value. The cumulative melt thickness represents a crustal thickness of 6.0 km, compared with our original value of 5.8 km. This test demonstrates that our conclusions are robust to reasonable changes in mantle source parameterisation.
The effect that including variable (but small) amounts of pyroxenite has upon melt production and composition also depends upon modelling assumptions. Changing the 143Nd/144Nd value of the pyroxenite component from 0.512733 to 0.512932 at Site FC increases the predicted value of εNd for the homogenised melt by 0.13, which is smaller than the typical measurement uncertainty for εNd. At VSR-3 (i.e. hole U1562B), which has a greater expected proportion of mantle pyroxenite (i.e. 2.6%), this change increases the εNd value of the homogenised melt by 0.63. Mantle pyroxenite would be required to increase up to 4.5% in order to match the observed value of εNd. The consequent enrichment of REEs within the melt that this additional pyroxenite requires can be offset by a ~15 ∘C increase in mantle potential temperature. This temperature increase does not materially alter the conclusions of our study. On the contrary, it augments the relative difference in temperature predicted for the FC and VSR/VST sites.
Finally, an alternative approach for parameterisation of the garnet-spinel transition assumes that transition depths are isobaric and uses the pressure range constrained by the thermodynamic framework of Tomlinson and Holland68 which are 2.23–2.52 GPa (i.e. 69–78 km). Testing these values led to a very minor change in calculated heavy REE concentrations, requiring no change to the predicted mantle potential temperature for Site FC. At higher temperatures (e.g. VSR-3: hole U1562B), a minor increase in the proportion of melting within the garnet stability field leads to depletion of heavy REEs whilst light REEs remain largely unchanged. To improve model fit, one option is to decrease mantle potential temperature whilst slightly lowering the mass fraction of mantle pyroxenite. The revised potential temperature is ~1400 ∘C, which remains significantly greater than ambient asthenospheric temperature and the predicted temperature for Site FC.