
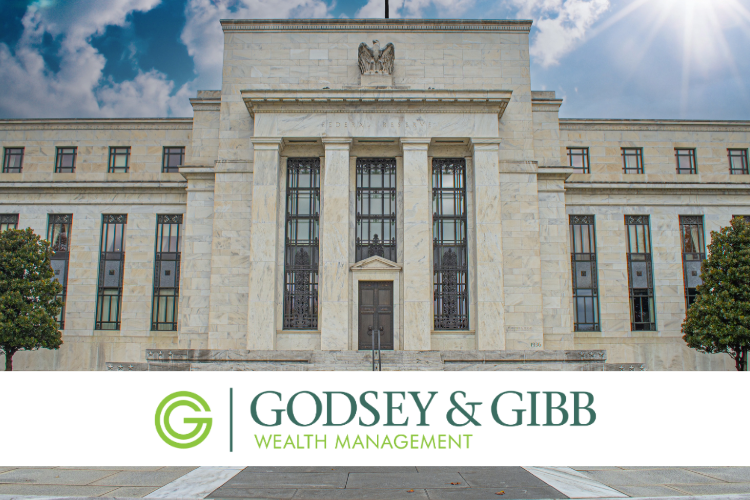
Getting Granular: Understanding Economic Data as a Long-Term Investor
A Timely Topic, Given Recent Fed Developments
When the Federal Reserve got a new chairman this year, most of the attention went to interest rates and how Kevin Warsh’s approach might differ from his predecessor, Jerome Powell. Less attention went to something we found more interesting: Warsh’s decision to create five internal task forces studying whether the Fed’s own analytical tools and monetary policy approach still hold up.
One task force stood out to us in particular: the group studying the “Use and Reliance on Existing Data,” led by Harvard economist Raj Chetty, former Walmart CEO Doug McMillon, and University of Chicago economist Kevin Murphy. Their job is to study the quality and timeliness of the economic data that shapes monetary policy.
That development gives us a timely opportunity to walk Richmond BizSense readers through some of this data: how it’s gathered, how it’s used, and where it can fall short before it drives real decisions about the economy.
The Fed’s Two Jobs, in Plain English
The Fed operates under what’s known as a dual mandate: keep inflation stable and support full employment. Both goals depend on having timely, accurate economic data. If the data arrives late, or turns out to be wrong once revised, policy decisions get made on an incomplete picture.
The same is true for us at Godsey & Gibb. The economic outlook we build informs both our top-down view of markets and our bottom-up analysis of individual companies. If the underlying data is shaky, the conclusions we draw from it need to account for that.
Where the Numbers Come From: BEA and BLS
Historically, most of the key data on the labor market, inflation, consumer confidence, and consumer activity has come from federal agencies, primarily the Bureau of Economic Analysis (BEA) and the Bureau of Labor Statistics (BLS). This data is widely followed and can move markets, but it doesn’t always meet the “timely and accurate” bar, and during government shutdowns it isn’t available at all.
Take the BLS’s monthly Nonfarm Payrolls (NFP) report. It’s a central gauge of labor market health, covering job gains by industry, hours worked, and wages. Since consumer spending drives roughly two-thirds of Gross Domestic Product, understanding the labor market is essential to forecasting growth.
The problem is that NFP has become more volatile and subject to larger revisions over time, largely because survey response rates have declined. The report is built from a survey of about 119,000 businesses and government agencies. Response rates used to run above 80%. They’ve since fallen to around 40% and dropped closer to 30% during the COVID-19 pandemic.
To help fill that gap, we also track private-sector reports like the ADP National Employment Report and Paychex’s Small Business Labor Market Data. These reports cover less ground than the BLS survey, but they’re built from actual payroll records rather than survey responses, which makes them a useful cross-check.
Measuring Inflation Is Trickier Than a Grocery Receipt
Inflation sounds simple to measure, but real-world examples reveal many underlying complexities. If a 55-inch 4K television costs more today than an older, lower-resolution model did a few years ago, is that inflation, or is it a better product? How do you measure housing costs when most housing units don’t regularly change owners, revealing their current market values through a sale?
To complicate things further, there isn’t one inflation index. There are several, and they use different methodologies and weightings. The Shelter component of the Consumer Price Index (CPI), which covers housing, rentals, and lodging away from home, makes up about 26 to 27% of the overall index. The Personal Consumption Expenditures Price Index (PCE) weights shelter closer to 15 to 18%.
Both indices lean heavily on survey data about the potential rental value of a home. The portion of CPI based on actual rents paid by tenants, about 6% of the index, tends to move slowly because real leases only reset when tenants renew, regardless of what’s happening in the broader rental market.
To get a clearer, faster read on housing costs, we track data from Zillow. Their Observed Rent Index is based on the median of listed rents across homes and apartments in major regions, filtered to the middle of the market. This market-based data correlates with the shelter components in CPI and PCE, but tends to lead them by several months, giving us an earlier signal of where official inflation readings are headed.
When the Data Goes Dark: COVID and Government Shutdowns
Most economic data arrive with a lag simply because of the time it takes to collect and process it. The BEA’s quarterly GDP report, for example, comes out in stages: an initial estimate about 30 days after quarter-end, with a final revision roughly 60 days later. Investors can’t wait 90 days to understand what’s driving the economy, so models get built to approximate current conditions using data released throughout the quarter.
Sometimes the data goes missing entirely. Last fall’s government shutdown delayed or halted collection of both labor market and inflation data. But the clearest example of needing a data bridge was the COVID-19 pandemic. With large parts of the economy shut down and reopening unevenly, it became difficult to track real-time activity through traditional reports.
To fill that gap, we started following market-based indicators that update daily or weekly. OpenTable’s reservation data, covering more than 65,000 restaurants globally, tracked closely with consumer spending on services when compared year over year. Transportation Security Administration (TSA) checkpoint data, which shows daily passenger throughput at airports, gave us an early read on when consumers felt comfortable traveling again, which helped us assess the leisure and hospitality sector. Neither data set painted a complete picture on its own, but together they bridged a real gap in our forecasting during a period when traditional data simply wasn’t keeping up.
How Does Understanding Economic Data Serve You?
Institutional investors and economists have long relied on an expanding mix of government and private data to make decisions about the economy and markets. That’s exactly the kind of process we run at Godsey & Gibb, not as an academic exercise, but as the foundation for the individual security decisions we make on our clients’ behalf, in collaboration with our Wealth Advisors and our Tax & Financial Planning team.
Firms that build portfolios out of broad mutual funds or ETFs theoretically can get by without performing similar analyses. Their job is largely to allocate across sectors and asset classes, not to understand the specific economic data points driving them. Our job is different. When we’re selecting individual stocks and bonds based on our own read of the economy, the reliability of the data behind that read matters enormously, which is why we spend real time understanding not just what the numbers say, but how they’re built and where they can mislead us.
We hope this gives you a better sense of the data we track to forecast economic activity, why that forecasting matters to our work in supporting our clients’ financial success, and why a task force dedicated to sorting out the reliability of economic data is a welcome development.
Jean McGowan, CFA serves as Chief Investment Officer at Godsey & Gibb Wealth Management, leading the firm’s investment research and portfolio management teams. Godsey & Gibb Wealth Management serves affluent families in the greater Richmond, VA, Greenville, SC, Phoenix, AZ, and Jacksonville, FL areas. Learn more at godseyandgibb.com or reach out at (804) 285-7333.

Print Article