
CHEYENNE – The 12th edition of “Wyoming and County Profiles” has been released by the state of Wyoming’s Economic Analysis Division.
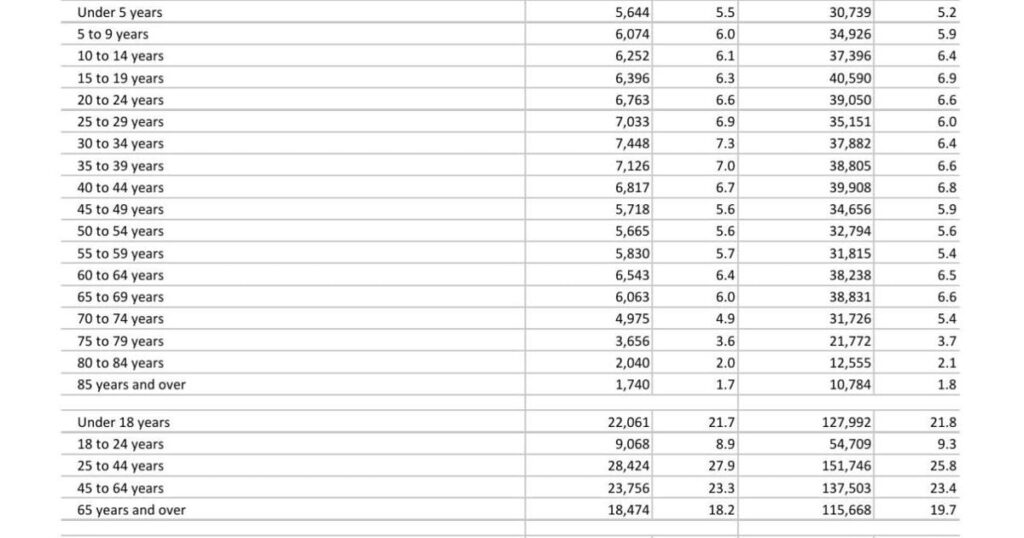
The updated publication provides a multitude of frequently requested statistics that measure demographic, social, economic, housing and revenue conditions of Wyoming and all 23 counties. More than 30 topics are covered, such as population by age and race, employment and wages by industry, educational attainment, income and poverty, commuting and land ownership.
“The County Profiles provide vital data about Wyoming and County residents, workforce, housing, and the economy. This reliable information about local areas is essential for governments, businesses, and communities to make well-informed decisions for strategic planning, economic development, and grant applications,” said Wenlin Liu, administrator with the Economic Analysis Division, in a news release.
A few highlights from the publication include:
- Net migration (number of people who moved in less people who moved out) for Laramie County was about 580 during 2024, compared with population loss in Teton County (-172).
- The largest minority group, Hispanic, made up 18.8% of the population in Carbon County, compared with 2.4% in Crook County and 11.1% for Wyoming.
- The proportion of the population age 25 and over with a bachelor’s degree or higher was 61.1% in Teton County, compared with 19.4% in Niobrara County and 30.6% for Wyoming as a whole.
- Approximately 1,607 people who lived in Albany County were commuting to Laramie County for work, while 1,478 workers were commuting from Lincoln County to Teton County.
- The proportion of federal land in Teton County was 91.9%; in contrast, it was 1% in Laramie County and 47.1% for Wyoming.
All profiles are available online at tinyurl.com/12th-wyo-county-profiles.