

This appendix provides complementary information to the results presented in Section “Results and discussion”, detailing the spatial distribution and seasonal variability of projected changes in temperature, precipitation, and streamflow across the Amazon Basin for the period 2015–2050. The analyses were derived from HydroBID simulations forced with downscaled climate projections under the SSP3-7.0 and SSP5-8.5 scenarios. Annual and seasonal maps were developed to highlight regional contrasts and intra-annual dynamics, with emphasis on the spatial coherence between projected climatic anomalies and corresponding hydrological responses.
The interpretation of these spatial patterns supports a basin-wide understanding of projected hydroclimatic stress, particularly during critical dry and transition seasons, and provides additional context for the sectoral exposure analysis discussed in the main text.
Projected changes in mean temperature
Projected changes in average annual temperature (Fig. 11) show a consistent warming trend across the Amazon Basin under both SSP3-7.0 and SSP5-8.5 scenarios relative to the 1981–2010 reference period. Under SSP3-7.0, warming is spatially widespread, with maximum increases ranging between + 1.1 °C and + 1.4 °C in the northern and central Brazilian Amazon and in the headwaters of the Madeira River (Bolivia). In contrast, relatively smaller increases are projected in the Andean region and the Colombian Amazon, generally ranging between + 0.9 °C and + 1.0 °C.
Under SSP5-8.5, warming intensifies and expands spatially, with anomalies reaching up to + 1.4 °C from the Madeira headwaters toward the central Brazilian Amazon. In other areas of Brazil and Peru, increases range between + 1.1 °C and + 1.2 °C, while Colombia and portions of the Andean Amazon continue to exhibit comparatively lower anomalies.

Changes in mean annual temperature (2015–2050) relative to the reference period 1981–2010 under: (a) SSP3-7.0 and (b) SSP5-8.5 scenarios. Values indicate projected temperature increases in °C, and class limits reflect scenario specific value ranges. Data source: authors’ elaboration based on ISIMIP3b climate forcing datasets. Maps were produced by the authors in ArcGIS Pro 3.2 (Esri, Redlands, CA, USA; https://www.esri.com/en-us/arcgis/products/arcgis-pro/overview) using the Esri Topographic basemap.
These spatial gradients reflect basin-wide amplification of temperature driven by global forcing, modulated by regional physiographic and climatic heterogeneity. Stronger warming over lowland Brazilian Amazon areas coincides with regions characterized by high atmospheric moisture recycling. While this spatial correspondence suggests potential land–atmosphere interactions, the present analysis does not explicitly model feedback mechanisms. Conversely, comparatively smaller anomalies in the Andean and western Amazon are consistent with the moderating influence of elevation and orographic processes.
Overall, projected warming within the midcentury timeframe is likely to increase evapotranspiration demand and may contribute to reduced soil moisture retention, potentially exacerbating dry season water deficits when combined with projected precipitation and streamflow reductions described in subsequent sections. These thermal shifts represent an important climatic driver of hydroclimatic stress across the basin.
Projected changes in mean precipitation
Under the SSP3-7.0 scenario (Fig. 12a), projected precipitation exhibits a heterogeneous spatial distribution, with reductions of up to -7.2% across extensive lowland and mountainous areas, and localized increases of up to + 6% in the Andes, Guainía, Vaupés, Guaviare (Colombia), and eastern Brazil.
In the Brazilian Amazon, negative anomalies between -2.5% and -7.2% predominate, especially in the central and southeastern sub-basins. These patterns indicate moderate but spatially coherent drying tendencies across portions of the basin under the intermediate emission pathway.
Under the SSP5-8.5 scenario (Fig. 12b), more widespread reductions are projected, reaching up to − 10% across much of the basin and up to -13% in Amapá (Brazil), with localized increases of around + 5% in the Andean Amazon and the Madeira Basin. Compared to SSP3-7.0, this scenario reflects a spatial expansion and intensification of negative precipitation anomalies, particularly across southern and eastern Brazil.

Changes in mean annual precipitation (2015–2050) relative to the reference period 1981–2010 under: (a) SSP3-7.0 and (b) SSP5-8.5 scenarios. Values indicate projected precipitation changes in %, with negative values representing reductions and positive values representing increases; class limits reflect scenario specific value ranges. Data source: authors’ elaboration based on ISIMIP3b climate forcing datasets. Maps were produced by the authors in ArcGIS Pro 3.2 (Esri, Redlands, CA, USA; https://www.esri.com/en-us/arcgis/products/arcgis-pro/overview) using the Esri Topographic basemap.
The spatial asymmetry between western (relatively more humid) and eastern (relatively drier) subregions highlights the interaction between large scale atmospheric circulation patterns and regional land–atmosphere processes. The combination of higher temperatures and declining rainfall over central and eastern Brazil may increase evapotranspiration demand and soil moisture deficits, thereby elevating exposure to seasonal drought conditions.
Conversely, modest precipitation increases along the Andean fringe may partially buffer runoff generation in localized headwater areas but are unlikely to fully compensate for basin-wide deficits in regions experiencing concurrent drying.
Overall, projected precipitation declines, although moderate in magnitude, represent an important climatic driver of hydrological imbalance when coupled with warming and streamflow reductions described in Section “Results and discussion”. The combined effects may intensify seasonal water scarcity and increase vulnerability of freshwater dependent ecosystems and productive sectors across the basin.
Projected changes in streamflow
Changes in precipitation and temperature influence streamflow and surface water availability through complex basin-scale processes. Under the SSP3-7.0 scenario (Fig. 13a), a general reduction in mean annual flow of up to -30.8% is projected, particularly across the northern, central, and southern portions of the basin. Localized increases of up to + 18.6% are observed in the Madeira River Basin, as well as isolated increases in the Andean region and eastern Brazil, indicating a heterogeneous spatial pattern of hydrological response.
Under the SSP5-8.5 scenario (Fig. 13b), flow reductions become more pronounced, reaching − 43.7% in critical areas such as the headwaters of the Madeira River in Bolivia. Across much of the basin, decreases range from -1% to -30%, with localized increases of up to + 7.5% in the Andes and eastern Brazil. The spatial configuration of these changes suggests an intensification of hydrological stress in the southern Amazon and headwater regions under the higher emission pathway.
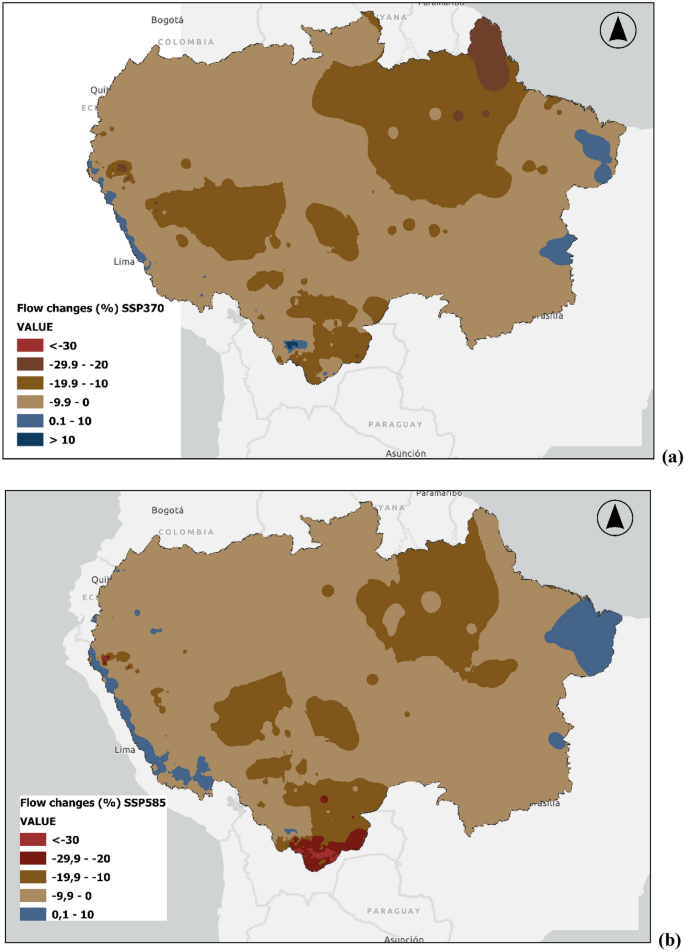
Changes in mean annual streamflow (2015–2050) relative to the reference period 1992–2014 under: (a) SSP3-7.0 and (b) SSP5-8.5 scenarios. Values indicate projected streamflow changes in %, with negative values representing reductions and positive values representing increases; class limits reflect scenario specific value ranges. Data source: authors’ elaboration based on HydroBID derived streamflow outputs. Maps were produced by the authors in ArcGIS Pro 3.2 (Esri, Redlands, CA, USA; https://www.esri.com/en-us/arcgis/products/arcgis-pro/overview) using the Esri Topographic basemap.
Seasonal analysis highlights the temporal amplification of these annual anomalies. During the December, January, February (DJF) season (Fig. 14), under SSP3-7.0, significant decreases in flow are projected in the Madeira River basin in Bolivia (up to -35.8%), as well as in southwestern Brazil and northern Peru. Localized increases of up to + 20% occur in the Brazilian Shield and northeastern basin (maximum + 25% in Maranhão), although with limited spatial extent. Under SSP5-8.5, the pattern of decline intensifies, with reductions exceeding -40% in the Bolivian headwaters and extending over much of the southern Amazon.

Changes in seasonal streamflow, DJF (2015–2050) relative to the reference period 1992–2014 under: (a) SSP3-7.0 and (b) SSP5-8.5 scenarios. Values indicate projected streamflow changes in %, with negative values representing reductions and positive values representing increases; class limits reflect scenario specific value ranges. Data source: authors’ elaboration based on HydroBID derived streamflow outputs. Maps were produced by the authors in ArcGIS Pro 3.2 (Esri, Redlands, CA, USA; https://www.esri.com/en-us/arcgis/products/arcgis-pro/overview) using the Esri Topographic basemap.
During the March, April, May (MAM) season (Fig. 15), marking the transition toward the dry period, both scenarios show continued intensification of flow reductions. Under SSP3-7.0, declines reach up to − 22.5%, primarily in southern Peru, northern Bolivia, and western Brazil, while modest increases (up to + 20%) appear in isolated areas of the Brazilian Shield and northern Amazon. Under SSP5-8.5, decreases of up to -34.8% dominate the Santa Cruz de la Sierra region (Bolivia), and extensive areas of the central and southern basin show reductions exceeding -20%. Compared to DJF, MAM displays a more spatially coherent pattern of decline.
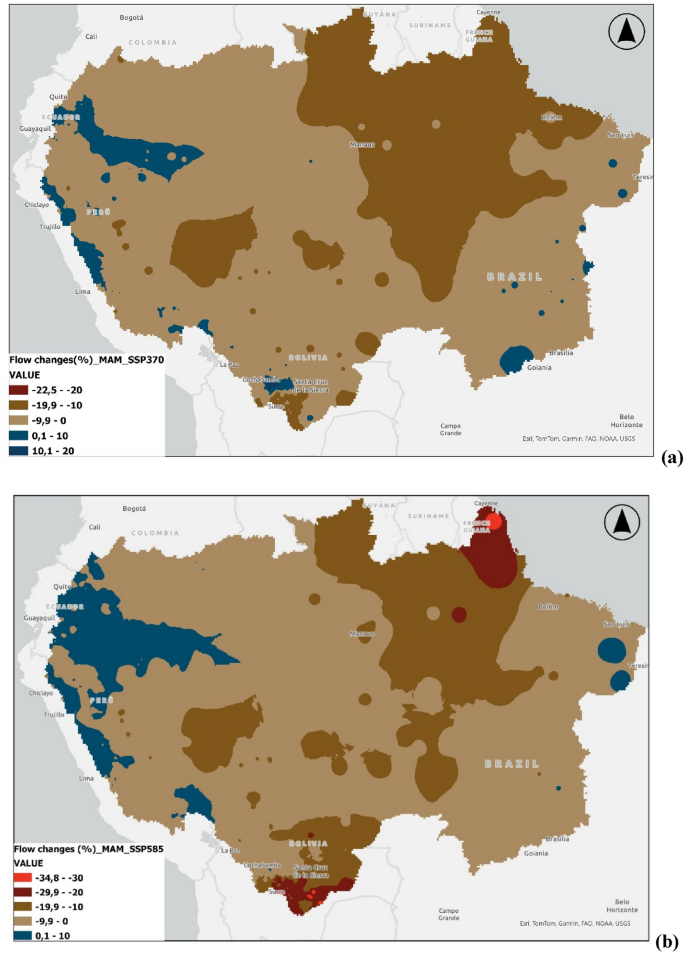
Changes in seasonal streamflow, MAM (2015–2050) relative to the reference period 1992–2014 under: (a) SSP3-7.0 and (b) SSP5-8.5 scenarios. Values indicate projected streamflow changes in %, with negative values representing reductions and positive values representing increases; class limits reflect scenario specific value ranges. Data source: authors’ elaboration based on HydroBID derived streamflow outputs. Maps were produced by the authors in ArcGIS Pro 3.2 (Esri, Redlands, CA, USA; https://www.esri.com/en-us/arcgis/products/arcgis-pro/overview) using the Esri Topographic basemap.
The June, July, August (JJA) season (Fig. 16), corresponding to the peak of the dry season, marks the period of greatest water stress. Under SSP3-7.0, general declines persist (up to -23.7%), especially in southwestern Bolivia and central Amazonia. Under SSP5-8.5, the Madeira River basin exhibits severe reductions of up to -38.6%, with widespread decreases (-10% to -30%) across the south and southwest. Isolated increases in the Andean northwest (Colombia, Ecuador, Peru) suggest localized orographic influences but remain insufficient to offset basin-wide deficits.

Changes in seasonal streamflow, JJA (2015–2050) relative to the reference period 1992–2014 under: (a) SSP3-7.0 and (b) SSP5-8.5 scenarios. Values indicate projected streamflow changes in %, with negative values representing reductions and positive values representing increases; class limits reflect scenario specific value ranges. Data source: authors’ elaboration based on HydroBID derived streamflow outputs. Maps were produced by the authors in ArcGIS Pro 3.2 (Esri, Redlands, CA, USA; https://www.esri.com/en-us/arcgis/products/arcgis-pro/overview) using the Esri Topographic basemap.
During the September, October, November (SON) season (Fig. 17), which coincides with the onset of the rainy season, significant flow reductions persist across both scenarios. Under SSP3-7.0, decreases reach -49.4% in the Madeira headwaters, with widespread declines of -20% to -40% across southwestern Amazonia (Peru), the Brazilian Shield, and northern Brazil. Under SSP5–8.5, similar magnitudes are observed (up to -47.9%), especially in north-central Brazil, western Amazonia, and the Peruvian Andes (Junín and Pasco). Nevertheless, localized positive anomalies of up to + 30% appear in upper Andean sub-basins (Apurímac, Ayacucho, Huancavelica), possibly associated with shifts in seasonal rainfall timing.
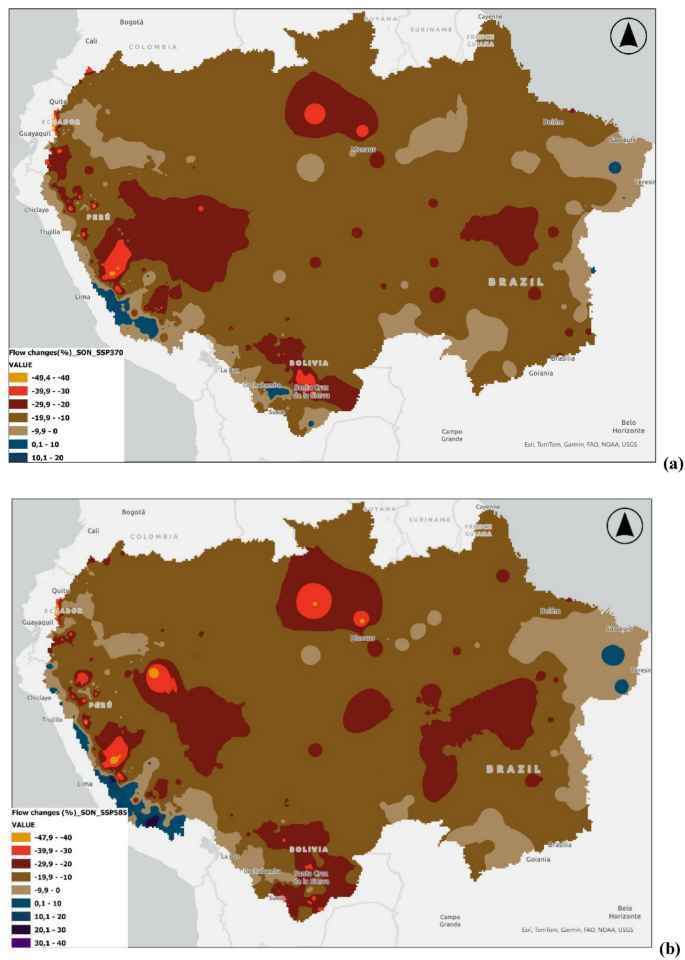
Changes in seasonal streamflow, SON (2015–2050) relative to the reference period 1992–2014 under: (a) SSP3-7.0 and (b) SSP5-8.5 scenarios. Values indicate projected streamflow changes in %, with negative values representing reductions and positive values representing increases; class limits reflect scenario specific value ranges. Data source: authors’ elaboration based on HydroBID derived streamflow outputs. Maps were produced by the authors in ArcGIS Pro 3.2 (Esri, Redlands, CA, USA; https://www.esri.com/en-us/arcgis/products/arcgis-pro/overview) using the Esri Topographic basemap.
Overall, the seasonal progression of flow anomalies reveals a persistent pattern of reduced discharge through much of the hydrological year under both emission pathways. The recurrence of negative anomalies across multiple seasons indicates potential constraints on baseflow recovery and recharge processes, increasing exposure to prolonged low flow conditions. These results highlight the sensitivity of the Amazon Basin’s hydrological system to combined climatic drivers and reinforce the importance of seasonally resolved assessments when evaluating future water-related hazards.
Summary
Overall, the climatic projections reveal a consistent intensification of hydrological variability across the Amazon Basin. The combined analysis of temperature, precipitation, and streamflow indicates that even moderate changes in rainfall, coupled with sustained warming, are associated with substantial reductions in water availability, particularly during the dry and transitional seasons.
These findings underscore the basin’s sensitivity to climatic forcing, where regional differences in topography, land cover, and atmospheric circulation generate highly heterogeneous hydrological responses. The persistence of seasonal flow deficits across large portions of the basin suggests increased exposure to prolonged low flow conditions and reduced inter-seasonal recovery capacity.
The spatial and seasonal patterns identified in this appendix provide a physical basis for the exposure analyses developed in the main sections of the study. In particular, the strong seasonal deficits simulated for the southern and central sub-basins help contextualize the exposure of human settlements, productive systems, and ecosystems discussed in the core results.
Collectively, these projections emphasize the importance of seasonally resolved hydrological assessments when evaluating future water-related hazards and adaptation needs across large tropical river basins.