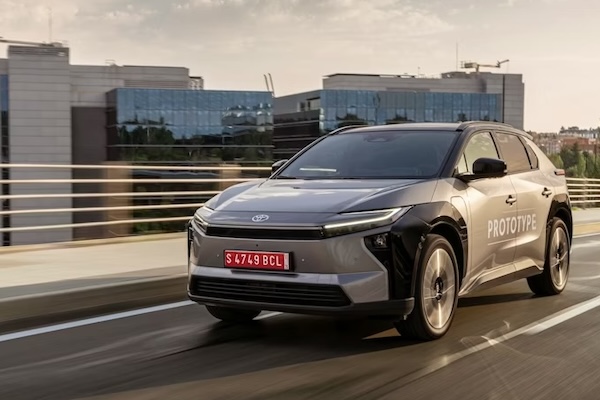
 The Toyota bZ4X is the best-selling vehicle in Finland for the first time.
It’s a disappointing month for new car sales in Finland, down a harsh -8.6% year-on-year in October to 5,685. Thanks to a solid volume in recent months, the year-to-date tally remains in positive at +4.1% to 62,618 units. Toyota (-36.7%) suffers from a particularly high year-ago performance but maintains itself in the lead with 14.9% share, yet this is way below its YTD level of 17.8%. Skoda (-9.7%) is back up three spots on last month to #2 despite falling faster than the market. It distances Volkswagen (-6.4%) and Kia (-15.1%). Mercedes (+26.6%) defies the negative market to return to the 5th place it holds year-to-date with Audi (+27.7%) and BMW (+10.3%) confirming the premium Germans are unaffected this month. Peugeot (+103.2%) delivers the biggest gain in the Top 10 while BYD (+8%) is up to a record #11 also reached in October 2025 and April 2026. Opel (+295.7%) and Cupra (+194.6%) post surreal gains below.
Model-wise, the Toyota bZ4X (+6925%) takes the lead for the first time after ranking #2 for two straight months, it ranks #3 year-to-date. The Toyota Yaris (-32%) is up to #2 but freefalls year-on-year. Two Skodas follow: the Elroq (+7.7%) up 9 spots on September to #3 and the Enyaq (-3.2%) up four to #4. The Mercedes GLC (+141.1%) brilliantly closes out the Top 5 thanks to its new BEV variant. The Audi Q4 (+106.7%) also impresses at #6 while the BMW iX3 scores a fourth Top 10 finish in the past 5 months at #10.
Previous month: Finland September 2026: Tesla Model Y at highest in 3 years
One year ago: Finland October 2025: Toyota at highest in almost 2 years, Yaris Cross distant leader
Full October 2026 Top 30 brands and Top 20 models below.
Note the following rankings feature the Top 30 brands and models year-to-date ordered based on their October sales and may therefore not be 100% accurate.
Finland October 2026 – brands:
| Pos |
Brand |
Oct-26 |
% |
/25 |
Sep |
2026 |
% |
/25 |
Pos |
FY25 |
| 1 |
Toyota |
847 |
14.9% |
– 36.7% |
1 |
11,136 |
17.8% |
+ 17.3% |
1 |
1 |
| 2 |
Skoda |
587 |
10.3% |
– 9.7% |
5 |
5,555 |
8.9% |
– 2.8% |
3 |
3 |
| 3 |
Volkswagen |
568 |
10.0% |
– 6.4% |
3 |
6,034 |
9.6% |
– 11.1% |
2 |
2 |
| 4 |
Kia |
423 |
7.4% |
– 15.1% |
4 |
3,853 |
6.2% |
– 22.3% |
6 |
5 |
| 5 |
Mercedes |
419 |
7.4% |
+ 26.6% |
6 |
3,995 |
6.4% |
+ 42.2% |
5 |
7 |
| 6 |
Volvo |
396 |
7.0% |
– 26.8% |
8 |
4,415 |
7.1% |
– 11.3% |
4 |
4 |
| 7 |
BMW |
353 |
6.2% |
+ 10.3% |
7 |
3,628 |
5.8% |
+ 20.2% |
7 |
6 |
| 8 |
Audi |
318 |
5.6% |
+ 27.7% |
10 |
3,049 |
4.9% |
+ 25.0% |
9 |
8 |
| 9 |
Ford |
206 |
3.6% |
– 10.4% |
9 |
2,265 |
3.6% |
– 6.0% |
10 |
9 |
| 10 |
Peugeot |
126 |
2.2% |
+ 103.2% |
19 |
799 |
1.3% |
+ 17.2% |
17 |
16 |
| 11 |
BYD |
121 |
2.1% |
+ 8.0% |
13 |
1,044 |
1.7% |
+ 115.3% |
14 |
18 |
| 12 |
Hyundai |
121 |
2.1% |
+ 19.8% |
18 |
1,196 |
1.9% |
– 35.2% |
12 |
12 |
| 13 |
Cupra |
109 |
1.9% |
+ 194.6% |
14 |
857 |
1.4% |
+ 106.5% |
16 |
23 |
| 14 |
Polestar |
94 |
1.7% |
– 11.3% |
12 |
1,060 |
1.7% |
– 12.6% |
13 |
13 |
| 15 |
Opel |
91 |
1.6% |
+ 295.7% |
28 |
654 |
1.0% |
+ 77.2% |
18 |
25 |
| 16 |
Nissan |
87 |
1.5% |
– 14.7% |
11 |
1,409 |
2.3% |
– 31.3% |
11 |
11 |
| 17 |
Tesla |
69 |
1.2% |
+ 46.8% |
2 |
3,282 |
5.2% |
+ 74.7% |
8 |
10 |
| 18 |
Citroen |
63 |
1.1% |
– 21.3% |
22 |
545 |
0.9% |
– 6.2% |
21 |
19 |
| 19 |
Renault |
54 |
0.9% |
– 57.5% |
15 |
926 |
1.5% |
– 24.1% |
15 |
14 |
| 20 |
Suzuki |
54 |
0.9% |
– 23.9% |
20 |
502 |
0.8% |
– 6.5% |
23 |
21 |
| 21 |
Lexus |
53 |
0.9% |
+ 35.9% |
24 |
462 |
0.7% |
+ 24.9% |
26 |
26 |
| 22 |
MG |
53 |
0.9% |
+ 15.2% |
23 |
493 |
0.8% |
+ 14.4% |
25 |
22 |
| 23 |
Subaru |
53 |
0.9% |
+ 96.3% |
16 |
495 |
0.8% |
+ 54.2% |
24 |
28 |
| 24 |
Dacia |
48 |
0.8% |
– 44.8% |
17 |
542 |
0.9% |
– 23.8% |
22 |
15 |
| 25 |
Mitsubishi |
40 |
0.7% |
– 11.1% |
26 |
454 |
0.7% |
– 22.9% |
27 |
20 |
| 26 |
Xpeng |
39 |
0.7% |
+ 333.3% |
25 |
256 |
0.4% |
+ 208.4% |
29 |
n/a |
| 27 |
Smart |
34 |
0.6% |
– 34.6% |
27 |
642 |
1.0% |
+ 144.1% |
19 |
24 |
| 28 |
Mazda |
33 |
0.6% |
– 36.5% |
21 |
600 |
1.0% |
– 4.5% |
20 |
17 |
| 29 |
Porsche |
21 |
0.4% |
+ 0.0% |
29 |
313 |
0.5% |
– 11.6% |
28 |
27 |
| 30 |
Land Rover |
15 |
0.3% |
+ 7.1% |
30 |
224 |
0.4% |
– 23.8% |
30 |
29 |
Finland October 2026 – models:
| Pos |
Model |
Oct-26 |
% |
/25 |
Sep |
2026 |
% |
/25 |
Pos |
FY25 |
| 1 |
Toyota bZ4x |
281 |
4.9% |
+ 6925.0% |
2 |
2,182 |
3.5% |
+ 437.4% |
3 |
n/a |
| 2 |
Toyota Yaris |
168 |
3.0% |
– 32.0% |
9 |
2,028 |
3.2% |
– 0.7% |
4 |
2 |
| 3 |
Skoda Elroq |
153 |
2.7% |
+ 7.7% |
12 |
1,406 |
2.2% |
+ 18.1% |
8 |
11 |
| 4 |
Skoda Enyaq |
150 |
2.6% |
– 3.2% |
8 |
1,357 |
2.2% |
– 3.6% |
9 |
6 |
| 5 |
Mercedes GLC |
135 |
2.4% |
+ 141.1% |
10 |
920 |
1.5% |
+ 104.4% |
17 |
n/a |
| 6 |
Audi Q4 |
124 |
2.2% |
+ 106.7% |
7 |
768 |
1.2% |
+ 15.0% |
22 |
19 |
| 7 |
VW ID.4 |
116 |
2.0% |
– 31.8% |
18 |
1,194 |
1.9% |
– 17.2% |
11 |
8 |
| 8 |
Toyota C-HR |
114 |
2.0% |
– 41.8% |
3 |
1,530 |
2.4% |
+ 26.9% |
6 |
12 |
| 9 |
Volvo EX40 |
102 |
1.8% |
+ 3.0% |
20 |
960 |
1.5% |
+ 29.9% |
15 |
16 |
| 10 |
BMW iX3 |
99 |
1.7% |
n/a |
n/a |
714 |
1.1% |
+ 5392.3% |
25 |
n/a |
| 11 |
Kia Stonic |
97 |
1.7% |
+ 27.6% |
11 |
762 |
1.2% |
+ 12.4% |
21 |
23 |
| 12 |
Toyota Corolla |
97 |
1.7% |
– 63.0% |
16 |
1,731 |
2.8% |
+ 0.2% |
5 |
3 |
| 13 |
BMW i4 |
96 |
1.7% |
+ 29.7% |
13 |
1,004 |
1.6% |
+ 82.9% |
14 |
26 |
| 14 |
Volvo XC60 |
85 |
1.5% |
– 58.9% |
15 |
1,249 |
2.0% |
– 17.0% |
10 |
7 |
| 15 |
VW ID.7 |
81 |
1.4% |
– 25.0% |
n/a |
831 |
1.3% |
– 27.4% |
18 |
13 |
| 16 |
VW Golf |
76 |
1.3% |
+ 46.2% |
n/a |
693 |
1.1% |
– 3.1% |
24 |
21 |
| 17 |
Mercedes CLA |
75 |
1.3% |
– 9.6% |
14 |
1,379 |
2.2% |
+ 365.9% |
7 |
n/a |
| 18 |
Audi Q6 |
73 |
1.3% |
+ 46.0% |
n/a |
711 |
1.1% |
+ 47.8% |
23 |
n/a |
| 19 |
Toyota Yaris Cross |
72 |
1.3% |
– 84.4% |
19 |
2,732 |
4.4% |
+ 22.1% |
1 |
1 |
| 20 |
Kia EV3 |
68 |
1.2% |
– 38.7% |
n/a |
743 |
1.2% |
– 16.3% |
20 |
14 |
| n/a |
Skoda Octavia |
63 |
1.1% |
– 42.2% |
n/a |
802 |
1.3% |
– 0.7% |
19 |
15 |
| n/a |
Volvo EX30 |
63 |
1.1% |
+ 3.3% |
n/a |
644 |
1.0% |
+ 28.3% |
26 |
30 |
| n/a |
Tesla Model 3 |
62 |
1.1% |
+ 520.0% |
4 |
897 |
1.4% |
+ 80.5% |
16 |
24 |
| n/a |
Ford Explorer |
54 |
0.9% |
+ 17.4% |
17 |
592 |
0.9% |
+ 42.0% |
28 |
n/a |
| n/a |
VW Tiguan |
52 |
0.9% |
– 21.2% |
n/a |
546 |
0.9% |
– 34.0% |
30 |
17 |
| n/a |
Nissan Qashqai |
42 |
0.7% |
– 37.3% |
5 |
979 |
1.6% |
– 25.8% |
13 |
9 |
| n/a |
VW T-Roc |
34 |
0.6% |
+ 183.3% |
n/a |
1,072 |
1.7% |
+ 327.1% |
12 |
n/a |
| n/a |
Polestar 4 |
31 |
0.5% |
– 47.5% |
n/a |
603 |
1.0% |
– 3.4% |
27 |
20 |
| n/a |
Smart #5 |
31 |
0.5% |
– 16.2% |
n/a |
567 |
0.9% |
+ 455.9% |
29 |
n/a |
| n/a |
Tesla Model Y |
7 |
0.1% |
– 81.1% |
1 |
2,373 |
3.8% |
+ 73.0% |
2 |
5 |
Source: AUT
