
A total of 283 metagenomic samples from different water environments, including natural water and wastewater, were collected. The natural water used was drinking water, groundwater, and marine. Wastewater included municipal wastewater, slaughterhouse wastewater, swine wastewater, duck wastewater, and hospital wastewater. Significant differences were found in the ARG composition among the different water environments (Fig. 1A) (R = 0.6674, P = 0.001). The number of subclasses of ARGs detected in wastewater was significantly higher than the number of subclasses of ARGs detected in natural water (82–534 and 2–145, respectively) (Fig. 1B) (P < 0.01). Differences in the number of ARGs detected between different wastewaters and between different natural waters were not significant (P > 0.05). The highest abundance of ARGs was detected in slaughterhouse wastewater (9.98 ± 1.04 copies/cell number), and the lowest abundance of ARGs was detected in marine (0.157 ± 0.013 copies/cell number) (Fig. 1C). The total abundance of ARG in municipal wastewater was not significantly different from that in natural water. The ARG abundance in the other wastewater was significantly higher than that in the natural water (P < 0.01). The ARG abundances in the municipal wastewater, drinking water, and groundwater were 0.767 ± 0.113, 0.705 ± 0.210, and 0.443 ± 0.171 copies/cell number, respectively. The ARG abundances in duck wastewater, swine wastewater, and hospital wastewater were 3.762 ± 0.677, 2.104 ± 0.257, and 2.521 ± 0.208 copies/cell number, respectively. The abundance units of ARGs were then transformed to Transcripts Per Million (TPMs) and the same results were found, with the highest abundance of ARGs in the slaughterhouse wastewater (Supplementary Data 1). The dominant ARG types varied in different water environments (Fig. 1D), with multidrug resistance genes dominating in groundwater, municipal wastewater, slaughterhouse wastewater, and hospital wastewater. The dominating The dominant ARG types in marine and duck wastewater environments were aminoglycoside and multidrug resistance genes. The dominant ARG types in swine wastewater were aminoglycoside, MLS, and tetracycline resistance genes. The dominant ARG types in drinking water were rifamycin and phosphonic acid resistance genes. These ARGs were mainly attributed to antibiotic efflux, antibiotic inactivation, and antibiotic target alteration classes of resistance genes (Supplementary Fig. 1). These results indicate that the composition of ARGs in different water environments varies significantly and that the abundance and number of ARGs in wastewater (especially slaughterhouse wastewater) are significantly higher than those in natural water (ANOSIM).
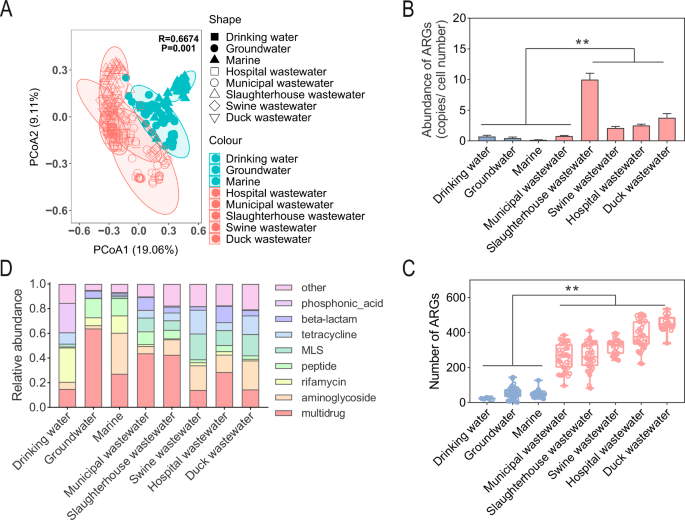
A PCoA of ARGs in water samples. B Abundance, C number, and D composition of ARGs. * and ** indicate P values less than 0.05 and 0.01, respectively. The upper, middle, and lower lines of the box plot indicate the 25% value, the mean value, and the 75% value, respectively. All bar graphs present the mean ± standard deviation.
Antibiotic resistome risk in different water environments
Then, we assessed the ARG risk in different water environments in terms of their mobility and correlation with pathogens. The abundance of MGEs was found to be highest in slaughterhouse wastewater (96.90 ± 8.57 copies/cell number), which was significantly higher than that in other water environments (P < 0.01) (Fig. 2A). This was followed by hospital wastewater, duck wastewater, drinking water, swine wastewater, municipal wastewater and groundwater, which had MGE abundances of 65.62 ± 6.55, 56.90 ± 7.01, 39.63 ± 11.56, 32.39 ± 4.62, 24.04 ± 3.73 and 17.67 ± 1.96 copies/cell number, respectively. The lowest MGE abundance was found in the marine environment with an abundance of 9.74 ± 0.69 copies/cell number. These MGEs were mainly distributed in the Integration/excision, Transfer, and Phage classes of MGEs (Supplementary Fig. 2). And in these water environments, we also detected different types of ARGs in the plasmid sequences, further validating the risk of ARGs transfer in the water environments (Supplementary Data 2). The results for the abundance of VFs were similar to those of MGEs (Fig. 2B). Again, the abundance of VFs was highest in slaughterhouse wastewater, followed by hospital wastewater, duck wastewater, drinking water, swine wastewater, municipal wastewater, and groundwater. The lowest abundance of VFs was found in marine environments. These VFs mainly consisted of adherence, immune modulation, motility, effector delivery system, stress survival, and nutritional/metabolic factor classes of VFs. Correlation analysis of these MGEs and VFs with ARGs revealed that tetracycline, phosphonic acid, MLS, and aminoglycoside resistance genes were positively correlated with the majority of MGEs and VFs (Fig. 2C). Peptide and Rifamycin resistance genes were negatively correlated with most of the MGEs and VFs. Then, we used the MetaCompare pipeline to assess the risk to the resistome based on the abundance, mobility, and pathogenicity of ARGs and found that slaughterhouse wastewater had the highest resistome risk score (59.56 ± 5.91), followed by hospital wastewater, municipal wastewater, swine wastewater, groundwater, duck wastewater, and drinking water (32.54 ± 1.36, 30.61 ± 3.65, 26.87 ± 0.49, 25.73 ± 1.11, 24.66 ± 0.86 and 23.22 ± 1.59, respectively) (Fig. 2D). The lowest resistome risk score (20.27 ± 0.11) was found in marine environments.
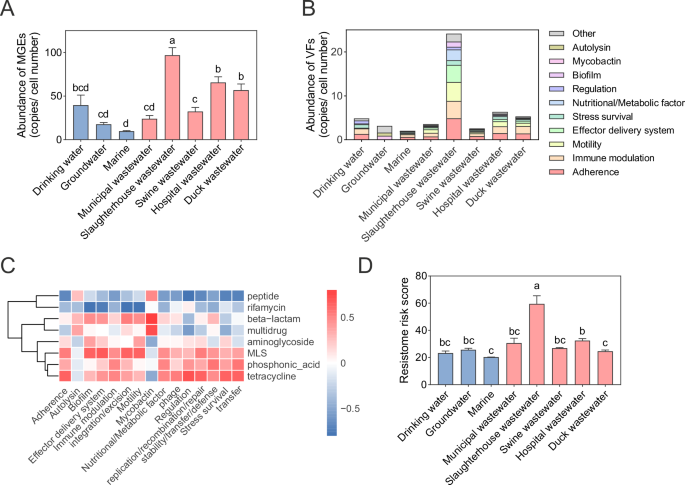
The abundance of A MGEs and B VFs. C The correlation between ARGs and MGEs and VFs. D Antibiotic-resistance risk scores in different water environments. Different letters indicate significant differences (P < 0.05). All bar graphs present the mean ± standard deviation.
Bacterial communities in different water environments
Bacteria are important ARG hosts and the main carriers of ARGs. We analyzed the bacterial communities in different water environments and found that groundwater had the lowest microbial richness index (615–4773), which was significantly lower than that in marine (6050–7081), pig wastewater (6007–7368), duck wastewater (5978–7316) and hospital wastewater (4582–6116) (Fig. 3A). The richness indices in the drinking water and slaughterhouse wastewater were 3590–5945 and 1899–6136, respectively. PCoA of the bacterial communities revealed that the microbial composition in marine differed significantly from that in other water environments (Fig. 3B). The differences in microbial composition in other water environments were not significant. The major phylum in these water environments was Proteobacteria (0.445–0.688), followed by Firmicutes (0.02–0.30), Actinobacteria (0.05–0.29), and Bacteroidetes (0.03–0.22) (Fig. 3C). The relative abundance of Bacteroidetes in marine environments was significantly higher than that in other water environments (P < 0.05). The relative abundance of Firmicutes in slaughterhouse wastewater, duck wastewater, and swine wastewater was significantly higher (P < 0.05) than that in other water environments. Correlation analysis of bacterial phyla with the abundance of different types of ARGs revealed that Proteobacteria, Firmicutes, Actinobacteria, and Bacteroidetes were positively correlated with each of the four types of ARGs (Fig. 3D). Proteobacteria were associated with MLS, multidrug, beta-lactam and peptide resistance genes. Firmicutes were positively correlated with tetracycline, MLS, beta-lactam, and aminoglycoside resistance genes. The abundance of Actinobacteria was positively correlated with the ARGs related to tetracycline, MLS, phosphonic acid, and rifamycin-like resistance.
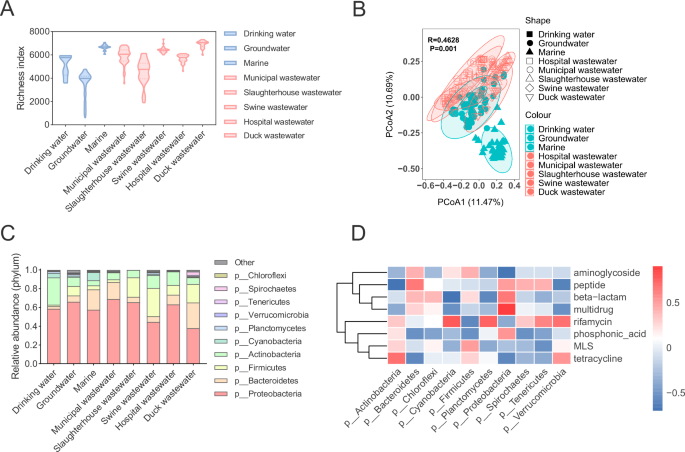
A Richness index, B PCoA, and C relative abundance of bacterial communities in the water samples. D Correlations between bacterial communities and ARGs. The upper, middle, and lower lines of the violin plot indicate the 25% value, the mean value, and the 75% value, respectively.
Hosts of antibiotic-resistance genes in different water environments
To further explore the relationship between microbial communities and ARGs, a total of 6167 high-quality MAGs were assembled using metagenomic binning from different water environment samples with greater than 50% genome integrity and less than 10% contamination (Supplementary Data 3). The GC content, N50, and size of these MAGs were 0.217–0.749, 1727–625,897 bp, and 319,964–15,240,531 bp, respectively. A total of 94.61% of them were bacterial genomes (n = 5861), and 5.39% were archaeal genomes (n = 306) (Fig. 4). The major bacterial phyla were Pseudomonadota, Bacteroidota, Patescibacteria, Bacillota_A, and Actinomycetota. The number of ARGs carried by these MAGs was analyzed, and it was found that 2719 MAGs carried ARGs and that they were considered the main ARG hosts. The profiles of the dominant ARG hosts differed among the different water environments. The most important ARG hosts (those with the 15 most abundant ARGs) in slaughterhouse wastewater all carried more than 20 ARGs. Duck wastewater had 5 major hosts with more than 20 ARGs. Municipal wastewater and hospital wastewater had 2 major hosts with more than 20 ARGs. There was only one host with more than 20 ARGs in the swine wastewater and groundwater. All the marine and drinking water samples had fewer than 20 ARGs. The major ARG hosts in drinking water, groundwater, marine, municipal wastewater, slaughterhouse wastewater, swine wastewater, duck wastewater, and hospital wastewater were Mycobacterium, Escherichia, Stutzerimonas, Mangrovibacter, Citrobacter, Escherichia, Desulfobacter, and Pseudomonas_E, respectively, which carried 8, 61, 19, 45, 52, 66, 62 and 27 ARGs, respectively. Among these major ARG hosts, Escherichia, Desulfobacter, and Citrobacter carried the highest number of ARGs. In addition, Pseudomonas_E was the most widely distributed ARG host in different water environments, and it was the major host in groundwater, municipal wastewater, slaughterhouse wastewater, swine wastewater, and municipal wastewater, carrying 11-38 ARGs. Then, a phylogenetic tree was produced for the MAGs carrying the 10 most abundant ARGs in different water environments (Fig. 5). These major ARG hosts were mainly distributed in Pseudomonadota, followed by Actinomycetota. The ARG hosts of both natural water (drinking water, groundwater, and marine water) and wastewater (municipal wastewater, slaughterhouse wastewater, swine wastewater, and hospital wastewater) were distributed among these phyla. These results suggest that the composition of ARG hosts in different water environments varies, with Escherichia, Desulfobacter, Citrobacter, and Pseudomonas_E being the main ARG hosts in water environments.
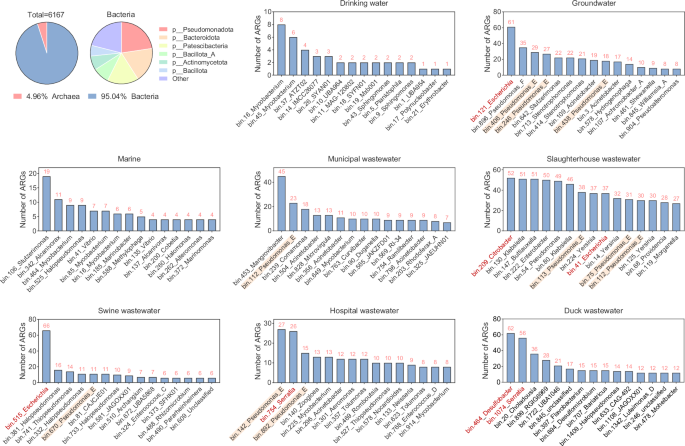
The pie chart shows the composition of the metagenome-assembled genomes. The bar chart shows the number of ARGs in the metagenome-assembled genomes.
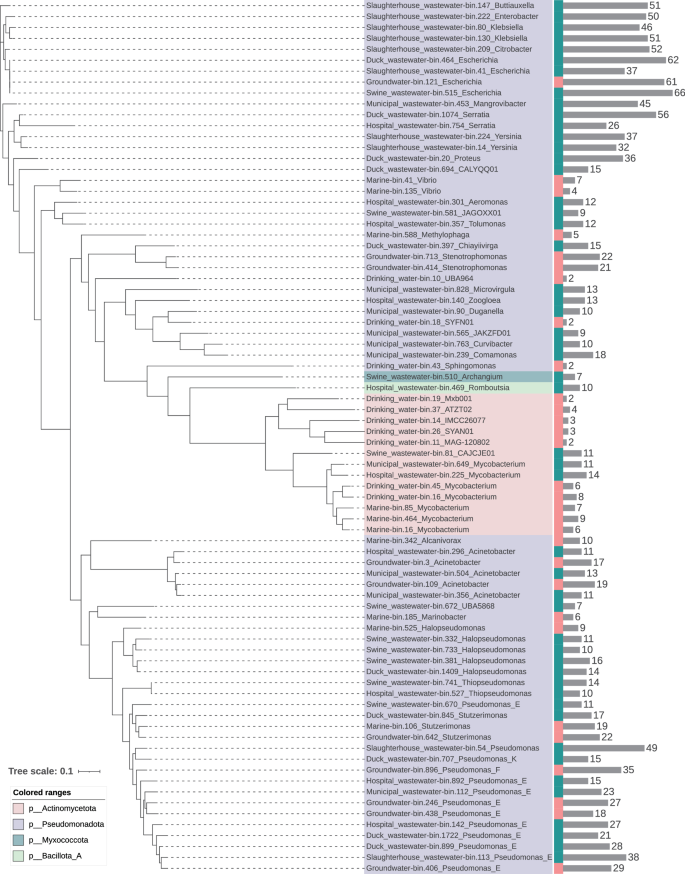
The values are the numbers of ARGs.
Horizontal gene transfer analysis of these MAGs revealed different transfer patterns in these different water environments (Supplementary Fig. 3). For example, horizontal gene transfer in slaughterhouse wastewater occurred mainly in Pseudomonadota, in duck wastewater in Bacillota_A, and in the marine in Bacteroidota. This also increases the risk of ARG transfer between different hosts.
Machine learning for predicting resistome risk of water environment
The above results show that there are different resistome risks and ARG hosts present in various water environments. And there is a correlation between microbial communities and resistome risk. It indicates that the microbial composition can represent the resistome risk. Then we used the machine learning method to predict resistome risk based on the microbial composition in the water environment (Fig. 6A). We set the median of resistome risk scores as the standard threshold (Fig. 6B). When the scores are greater than 25, it is high risk; when the score is below 25, it is low risk. Six machine learning methods were used (Fig. 6C and Supplementary Table 2). And XGBoost was found to be the best method with an accuracy was 86.87 ± 1.18%, followed by Random Forest (85.65 ± 1.23%), Decision Tree (82.13 ± 1.33%), Naive Bayes (81.41 ± 1.45%), SVM (70.67 ± 0.48%) and KNN (60.95 ± 0.48%). Their AUCn (Area Under the Curve) were 0.95,0.95,0.8,0.87,0.74 and 0.63, respectively. In summary, the XGBoost model has high accuracy and can be used to predict resistance risk in unknown aquatic environments.
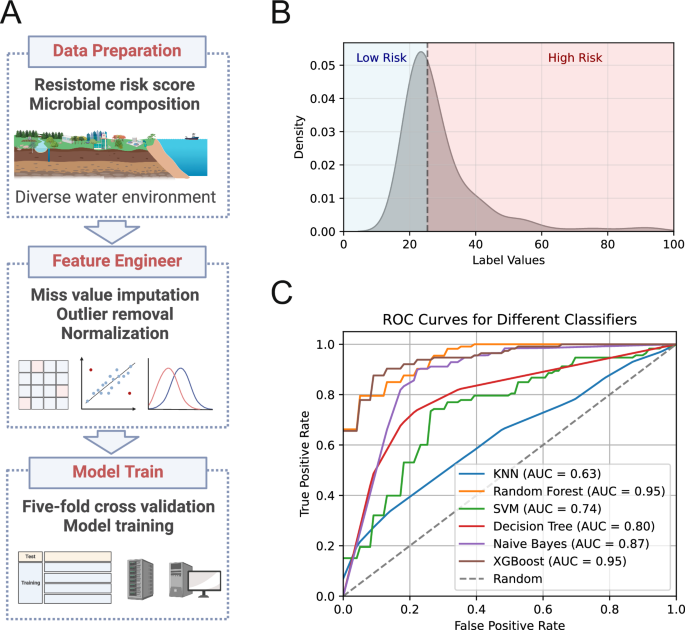
A Workflow of model training. B The distribution of resistome risk score in water samples. Label values were the reistome risk scores. C Receiver Operating Characteristic (ROC) Curve for different classifiers.