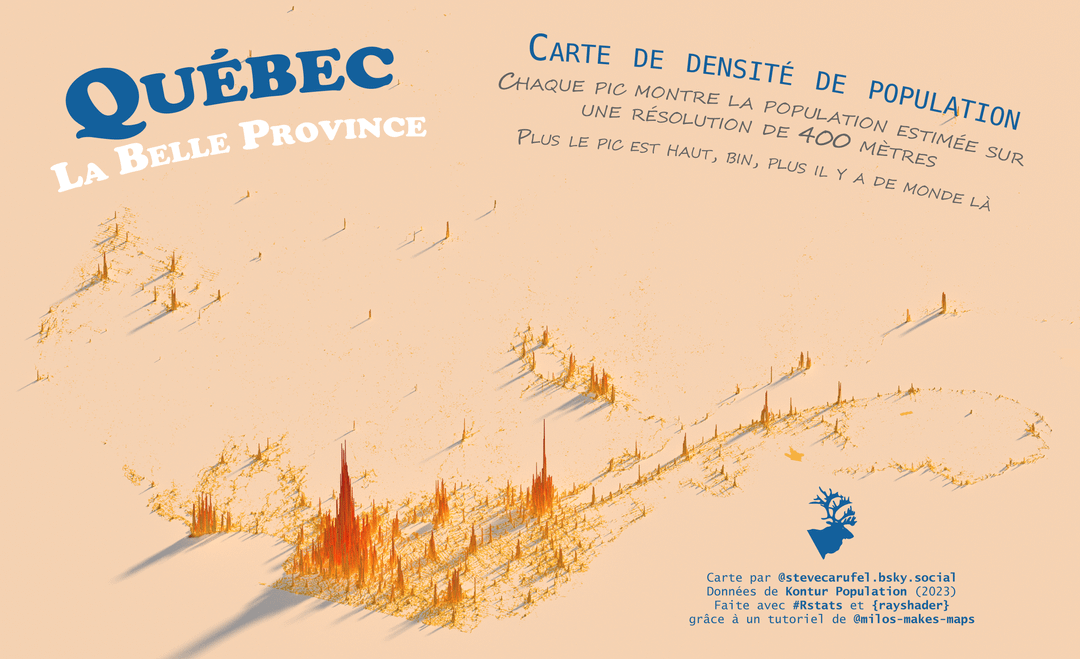
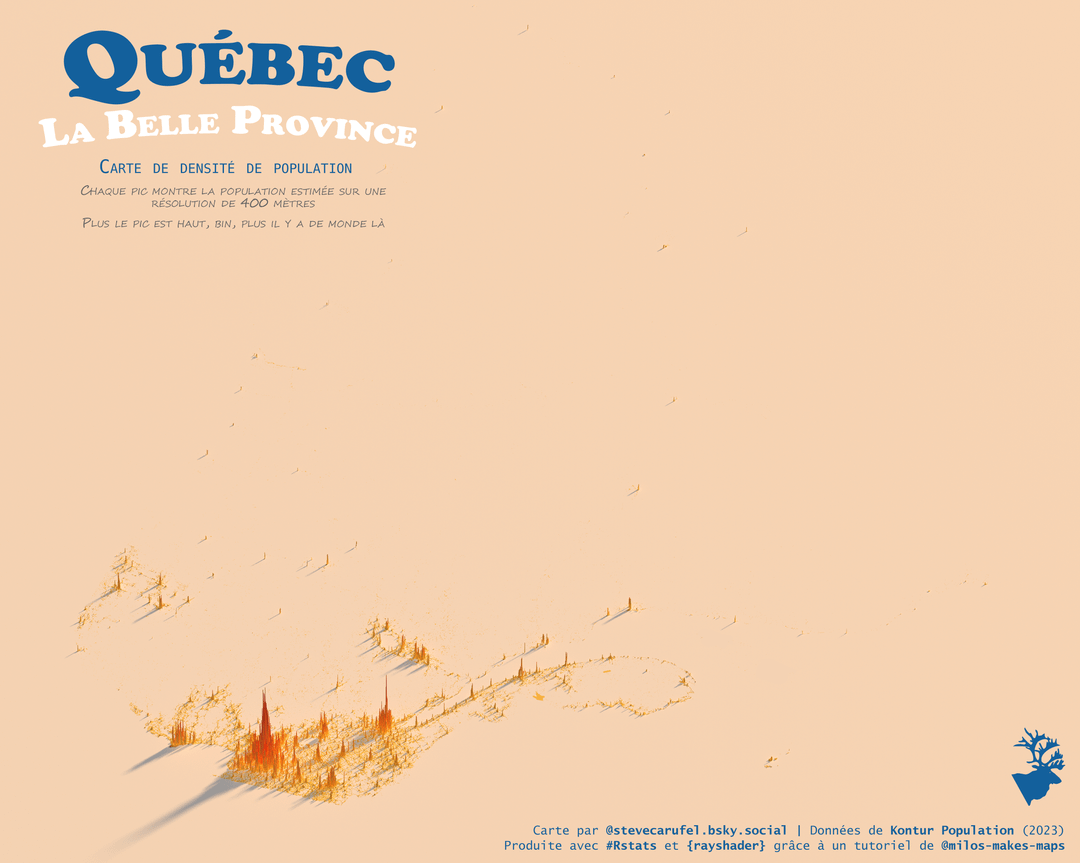
Share Facebook Twitter LinkedIn Pinterest Bluesky Threads [OC] Quebec Population Density Map Posted by dairyfreemilkexpert
dairyfreemilkexpert on May 31, 2025 5:06 pm Made with R and {rayshader} thanks to a tutorial by milos-makes-maps : [https://www.youtube.com/watch?v=qTDf5VVnjMM&pp=ygUYbWlsb3MgbWFwcyBzcGlrZSBkZW5zaXR5](https://www.youtube.com/watch?v=qTDf5VVnjMM&pp=ygUYbWlsb3MgbWFwcyBzcGlrZSBkZW5zaXR5) Data is from Kontur Population (2023), an estimate based on multiple sources from satellites and websites : [https://data.humdata.org/dataset/kontur-population-canada](https://data.humdata.org/dataset/kontur-population-canada) Github repo and code [https://github.com/datacarvel/quebec3dpop](https://github.com/datacarvel/quebec3dpop)
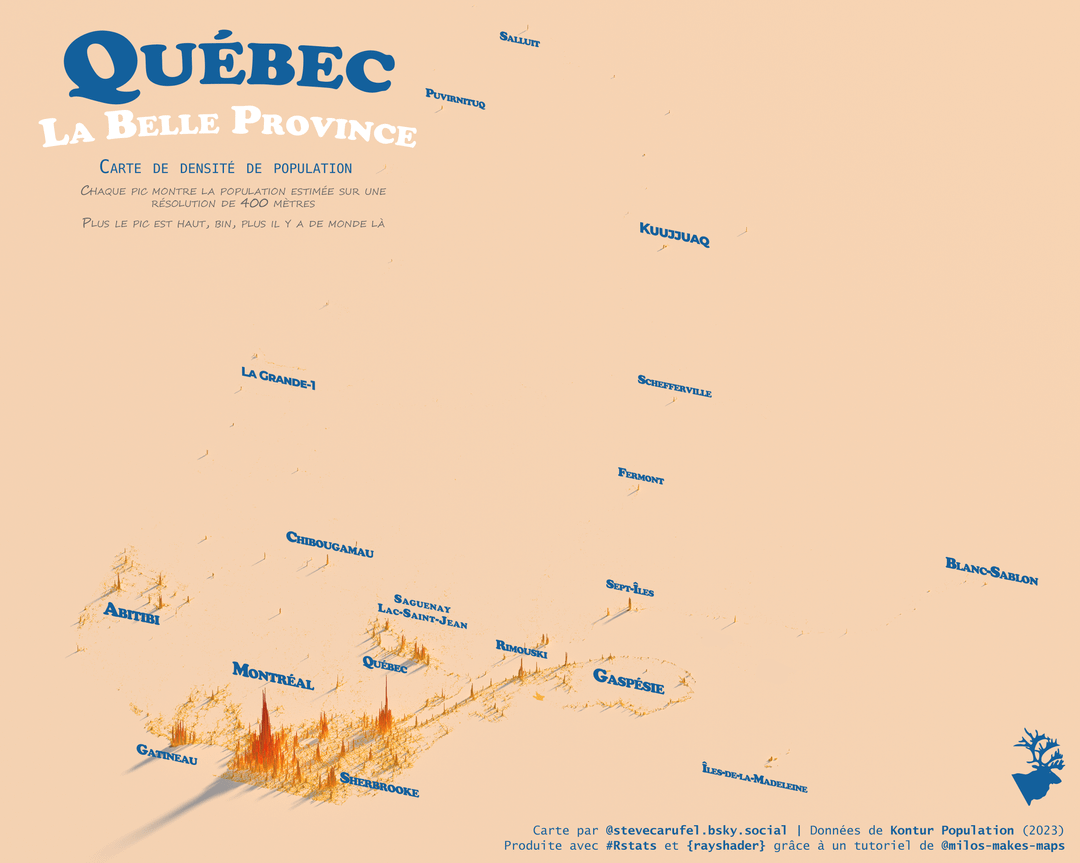
Un-Humain on May 31, 2025 5:15 pm A mix of the unique perspective and the lack of geographical or administrative features makes it pretty, sure, but quite hard to understand.
4FriedChickens_Coke on May 31, 2025 5:26 pm Would be more legible if there was an outline of the province’s boundaries
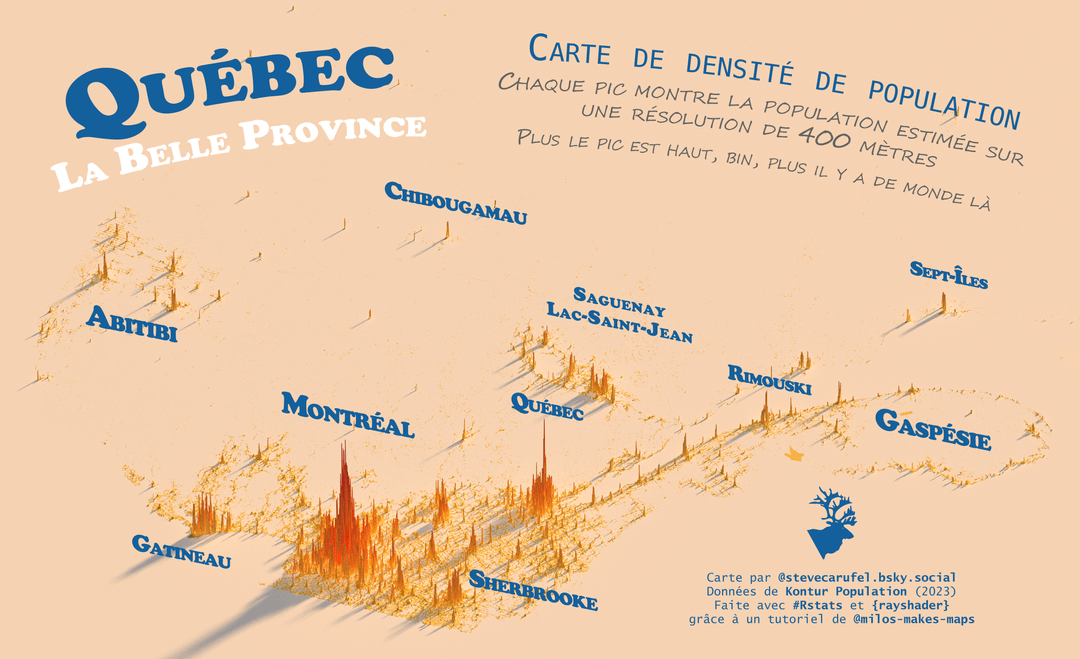
Cormacolinde on May 31, 2025 5:34 pm Quite well-done. I could identify most of the cities and towns without the legend.

![[OC] Quebec Population Density Map](https://www.byteseu.com/wp-content/uploads/2025/05/q00hvmawe54f1-1024x625.png "[OC] Quebec Population Density Map")
4 Comments
Made with R and {rayshader} thanks to a tutorial by milos-makes-maps : [https://www.youtube.com/watch?v=qTDf5VVnjMM&pp=ygUYbWlsb3MgbWFwcyBzcGlrZSBkZW5zaXR5](https://www.youtube.com/watch?v=qTDf5VVnjMM&pp=ygUYbWlsb3MgbWFwcyBzcGlrZSBkZW5zaXR5)
Data is from Kontur Population (2023), an estimate based on multiple sources from satellites and websites : [https://data.humdata.org/dataset/kontur-population-canada](https://data.humdata.org/dataset/kontur-population-canada)
Github repo and code [https://github.com/datacarvel/quebec3dpop](https://github.com/datacarvel/quebec3dpop)
A mix of the unique perspective and the lack of geographical or administrative features makes it pretty, sure, but quite hard to understand.
Would be more legible if there was an outline of the province’s boundaries
Quite well-done. I could identify most of the cities and towns without the legend.