
![Temperatures, cloudiness and precipitations in Montreal, Ottawa and Quebec City, April and May [OC]](https://www.byteseu.com/wp-content/uploads/2025/06/n2ap6r7dkb5f1-1024x519.png "Temperatures, cloudiness and precipitations in Montreal, Ottawa and Quebec City, April and May [OC]")
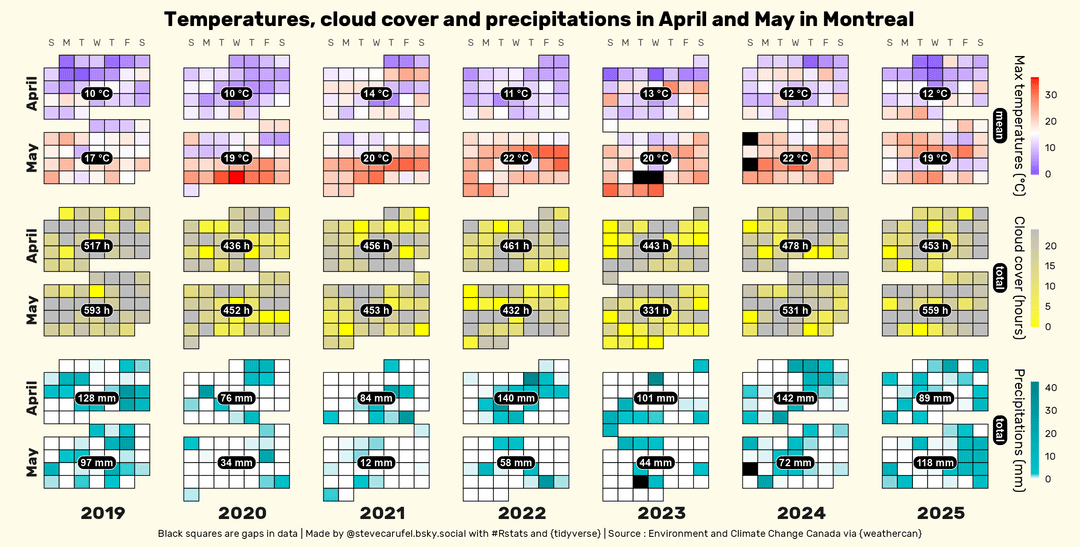
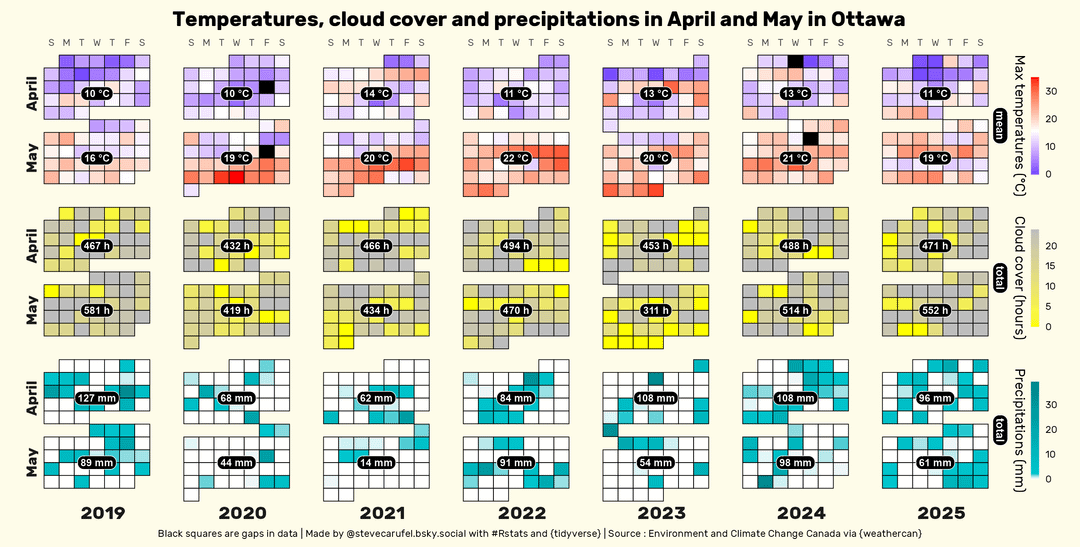
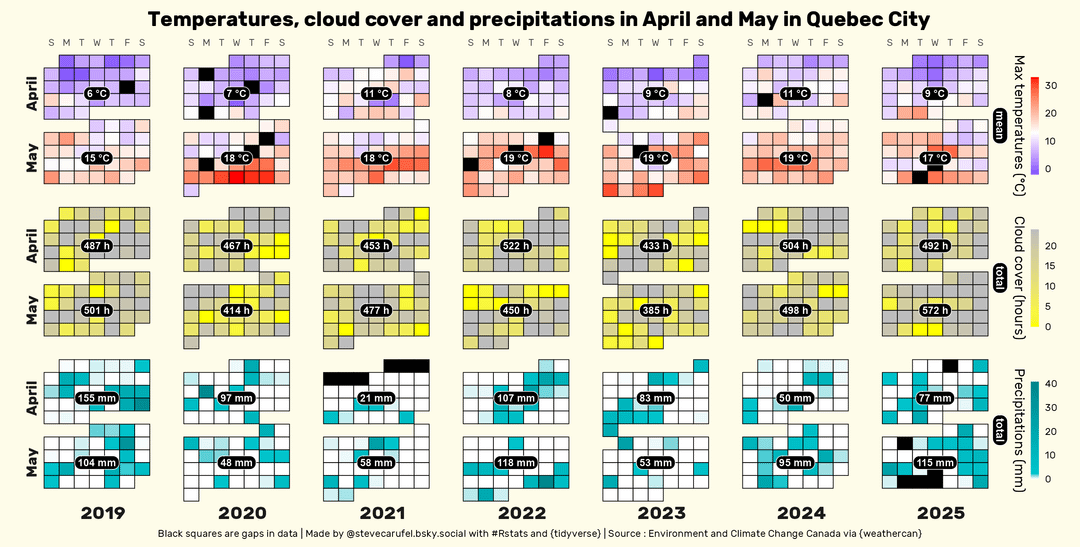
So we all knew it already here in Montreal and around, but spring, and especially May was terrible this year, but I still wanted to see how obvious it was in the data – and also because I love calendar heatmaps ✌️
You can see here daily max temperatures, cloud cover duration (hours) and precipitations (which may include snow as measured in equivalent mm, some snow typically falls once or twice in April but rarely in May)
Tools : R and packages {tidyverse} {ggcal} {patchwork} {weathercan}
Github repo, code and precisions on methodology : https://github.com/datacarvel/lamespring/
Source : Environment and Climate Change Canada, data acquired via the {weathercan} R package.
Example of how the hourly data looks like on ECCC's site : https://climate.weather.gc.ca/climate_data/hourly_data_e.html?hlyRange=2013-02-13%7C2025-05-30&dlyRange=2013-02-14%7C2025-05-30&mlyRange=%7C&StationID=51157&Prov=QC&urlExtension=_e.html&searchType=stnName&optLimit=specDate&StartYear=2025&EndYear=2025&selRowPerPage=25&Line=0&searchMethod=contains&txtStationName=montreal&timeframe=1&time=LST&Year=2025&Month=5&Day=16
Posted by dairyfreemilkexpert
3 Comments
Ah, the green squares of late may 2022, when 195 km/h winds made a good effort at blowing my neighbourhood away in Ottawa.
Where’d you get the sunshine hours data? I don’t see it provided from the Governments site.
Props for turning our shared weather misery into beautiful data visuals! Mother nature owes us a solid summer.