
Preface: This post was initially removed because it wasn't personal data day, but thanks to those who responded the first time. Duly noted on series reordering being necessary for the first plot. Google sheets makes this quite a pain, but I will do that before an update post sometime next year.
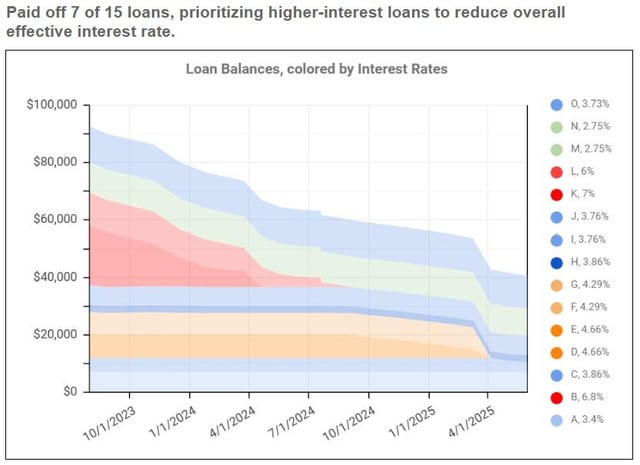
Playing around with the use of dynamic figure captions to summarize plots, interested to hear thoughts. Made with Google Sheets. Loans due to a few semesters of community college (2010-2012), two bachelor's degrees at separate universities (2012-2016 and 2021-2024) and a semester of pharmacy school (2017), resulting in 15 loan groups. Did not start tracking, or paying any meaningful amounts until the start of 2021. Today I am 71.1% of the way to checking off my #1 bucket list item.
In case it is unclear why the second plot shows a greater amount paid than accrued in loans, it is because that series includes direct payment of tuition (as noted in the legend).
Posted by Particle-in-a-Box
3 Comments
Great progress! 🙂
These look great! Especially the first graph. You seem to be paying your debts off intelligently and with discipline, may I ask what field you are working on?
I am honestly fascinated by how “comfortable” Americans seem to be with debt from a young age. I now had to get a mortgage to buy a house at age 33, and the idea has been kind of psychologically taxing but I have held a well paying job for some years now, so I could deal.
If I had had to take out 150k of 20 different loans at age 18 with no skills, no clue and a grand total of 3k EUR to my name, I think I would have just become a plumber instead.