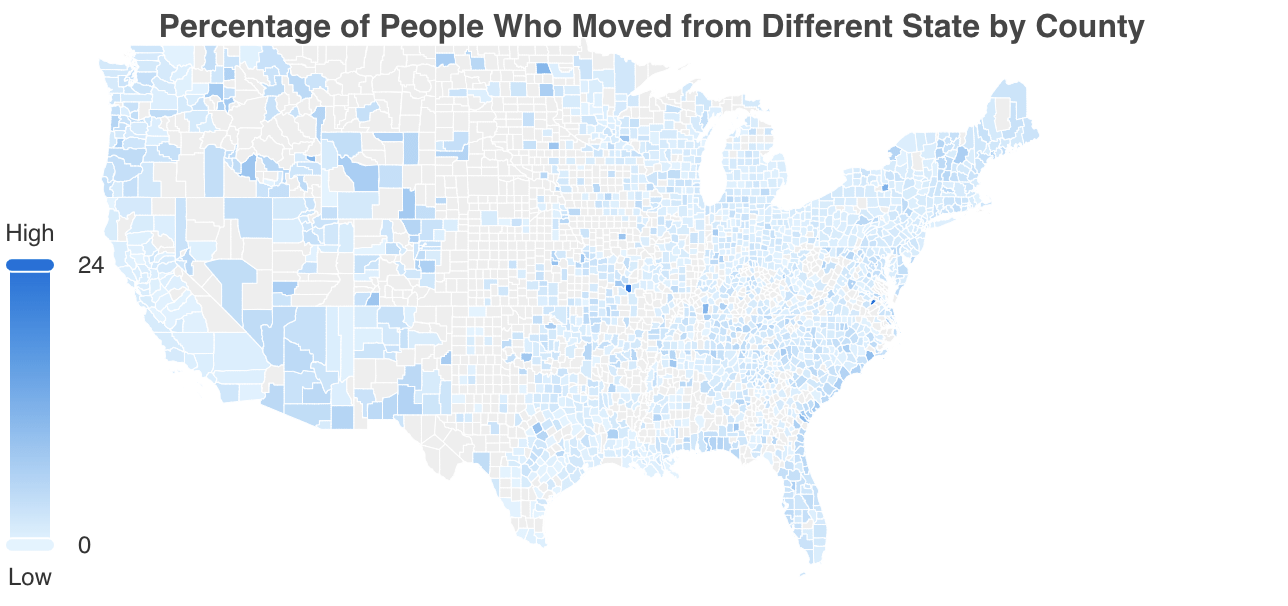
[OC] Percentage of Population That Moved From a Different State in the Past Year by County (2023)
Posted by philosophyof

![[OC] Percentage of Population That Moved From a Different State in the Past Year by County (2023)](https://www.byteseu.com/wp-content/uploads/2025/06/pvfs9nue8y8f1-1024x482.png "[OC] Percentage of Population That Moved From a Different State in the Past Year by County (2023)")
[OC] Percentage of Population That Moved From a Different State in the Past Year by County (2023)
Posted by philosophyof
9 Comments
I made the chart here: [https://selecteight.com/census](https://selecteight.com/census)
Data is from 2023 Census ACS
FORGOT TO LABEL: grey counties have no data
With more distinct colors this could be pretty dang beautiful
A log scale (or, perhaps, 5-10 buckets defined by percentile) with a darker extreme might give a better level of detail for all the counties that aren’t at the high extremes. Outliers can make continuous color scales lead to the “everything is baby blue” we see here.
Cool data. I think it might be helpful to include state lines in black, though, in addition to a starker color gradient mentioned elsewhere.
So what’s the story behind that one dark county in Missouri? College town? Large immigrant community? Someone find gold there?
Huh. Wonder what caused the relatively large influx of out of staters to Prince George County in VA. There is fuck-all going on in that county.
*edit- oh, right, the Fort formerly known as Lee then Gregg-Adams now back to Lee. Population of about 8.3k in a County with a total population of about 43k. An influx of new boots would skew the numbers pretty quickly.
Data is never beautiful when Alaska and Hawaii are left off the map — especially a map about transient populations because we have one of the higher rates. 🤷🏻♀️
Are you sure that you’re interpreting the data correctly? A county with 10% of its population newly-arrived in the past year would be an epic shift in all but the most rural of counties.
Here’s an example. As of 2023, Larimer county, CO had a population of 370,771. In the “Annual and Cumulative Estimates of the Components of Resident Population Change for Counties: April 1, 2020 to July 1, 2023 (CO-EST2023-COMP)” dataset, Larimer county experienced a net domestic migration of 2,249 from July 1st, 2022 to July 1st, 2023. That’s less than 1%. The color of Larimer county in the chart is more like 18% I’d guess.
With what have you made the visualization