haydendking on June 28, 2025 7:00 pm Data: [https://apps.bea.gov/regional/downloadzip.htm](https://apps.bea.gov/regional/downloadzip.htm) Tools: R (packages: dplyr, ggplot2, sf, usmap, tools, ggfx, grid, scales)
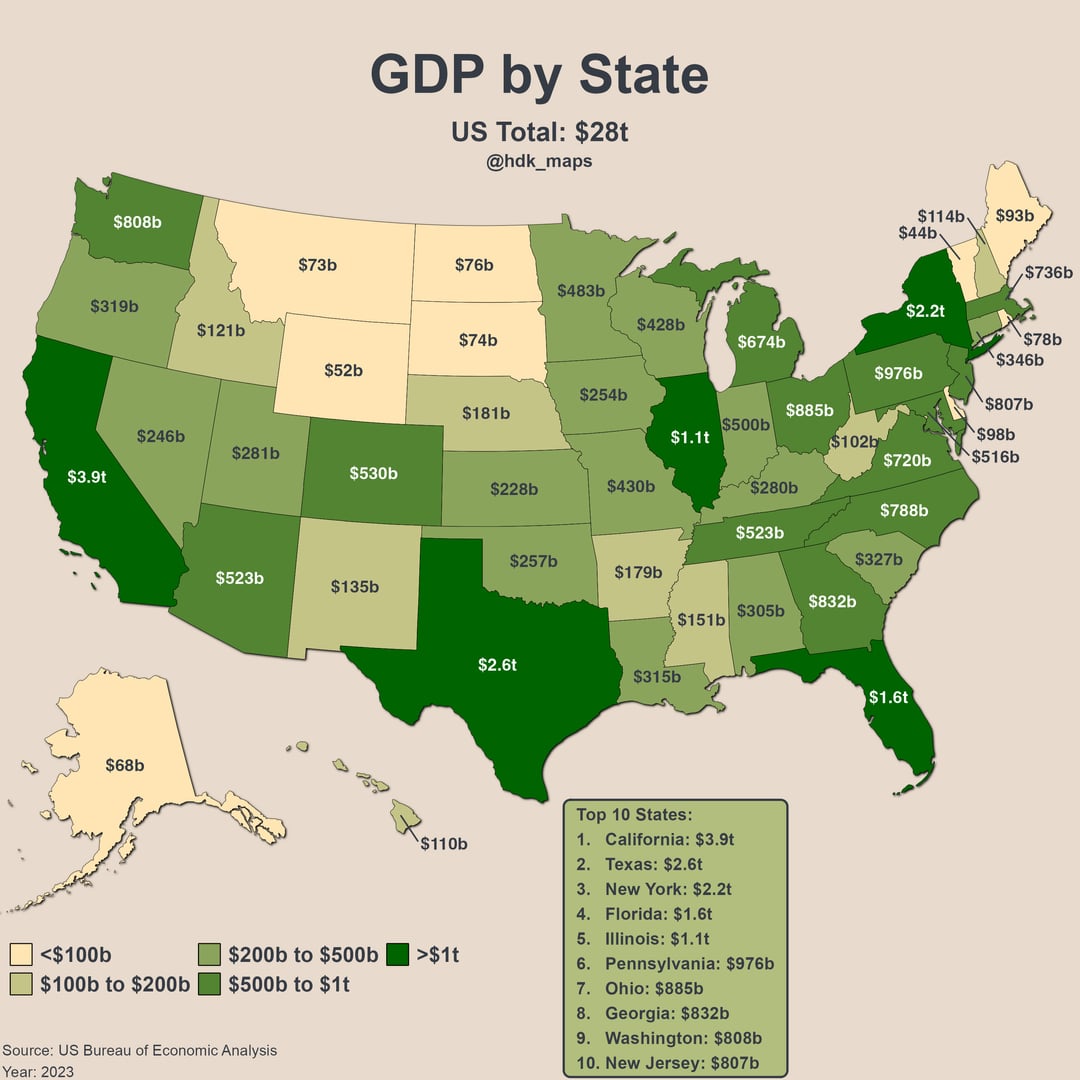
defroach84 on June 28, 2025 7:04 pm Oil and farming in Texas pays well. If you own land that isn’t even good for farming, you still have wind production and chances of oil.
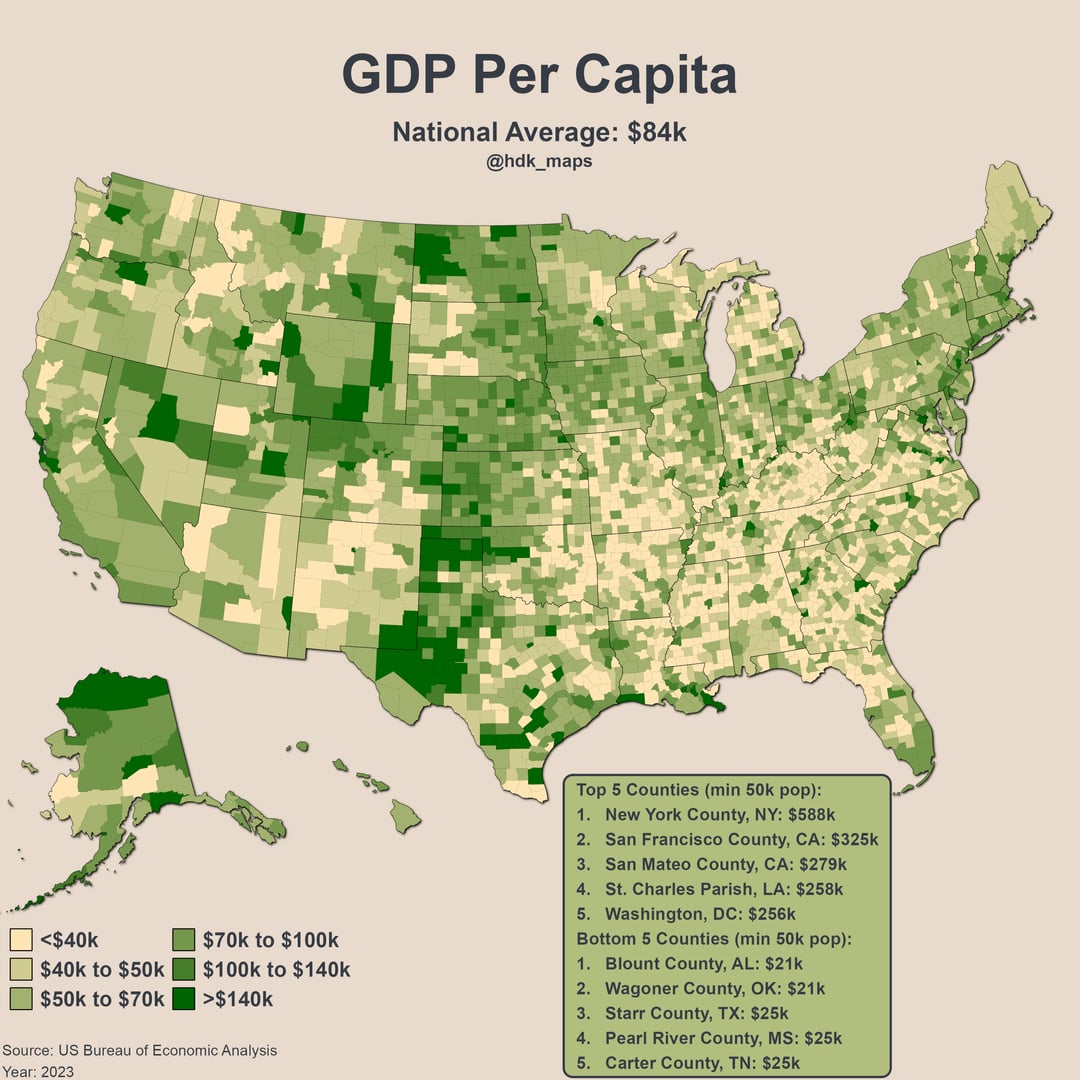
dainty-defication on June 28, 2025 7:11 pm What is up with st Charles Louisiana? Doesn’t exactly look like a prosperous area
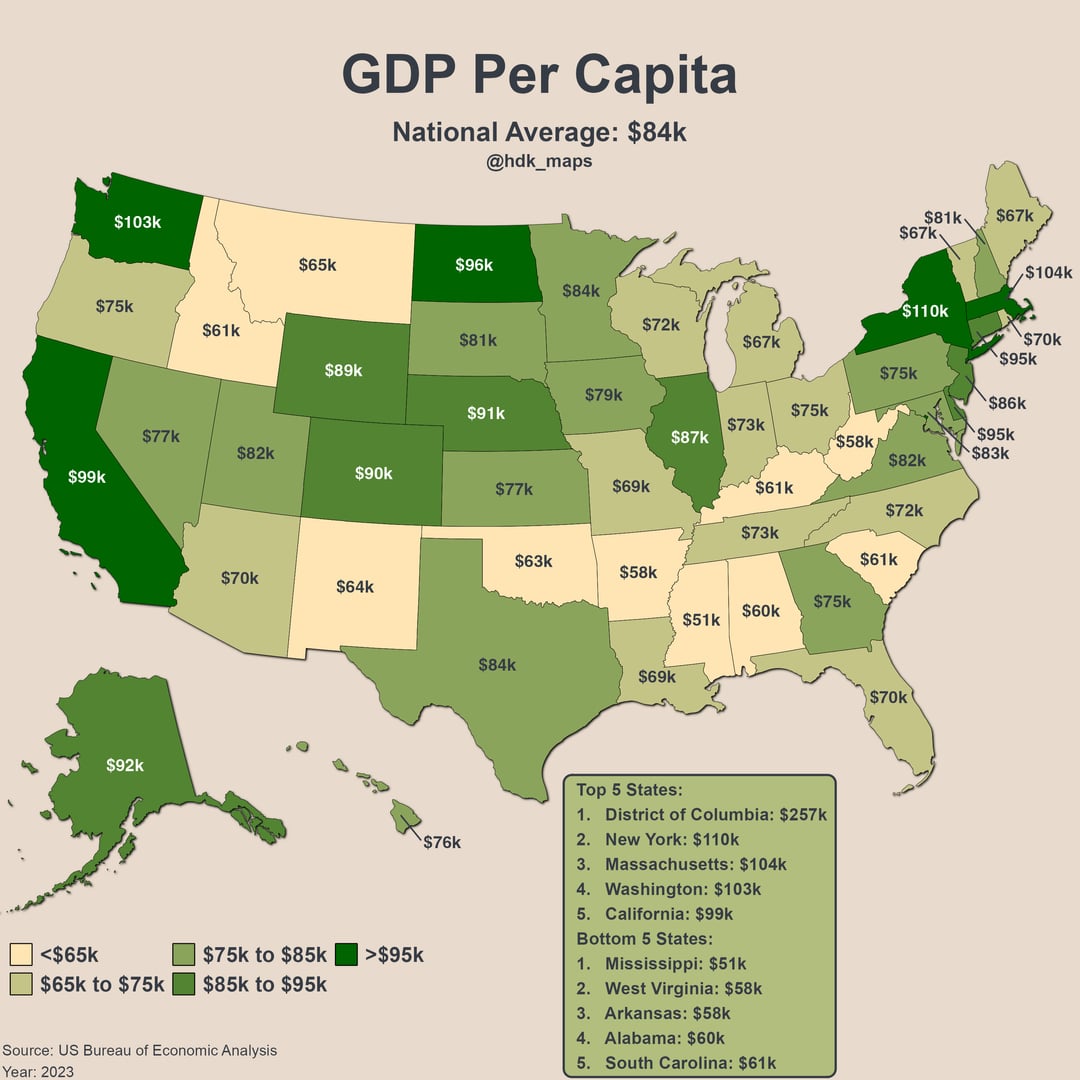
pocketdare on June 28, 2025 7:19 pm Ah FINALLY – a county-level breakdown. This data never proves of much of use at the state level.
EconomicResponse on June 28, 2025 7:41 pm My goal is to earn a dark green salary in a tan/yellow county.

![[OC] GDP in the US](https://www.byteseu.com/wp-content/uploads/2025/06/ar5d6fsutp9f1-1024x1024.jpg "[OC] GDP in the US")
10 Comments
Data: [https://apps.bea.gov/regional/downloadzip.htm](https://apps.bea.gov/regional/downloadzip.htm)
Tools: R (packages: dplyr, ggplot2, sf, usmap, tools, ggfx, grid, scales)
Oil and farming in Texas pays well. If you own land that isn’t even good for farming, you still have wind production and chances of oil.
I’d sure like to see median values rather than mean…
What is up with st Charles Louisiana? Doesn’t exactly look like a prosperous area
Hey look, all the O&G fields. The refineries, too.
Ah FINALLY – a county-level breakdown. This data never proves of much of use at the state level.
[deleted]
Always crazy to see how poor the south is.
My goal is to earn a dark green salary in a tan/yellow county.
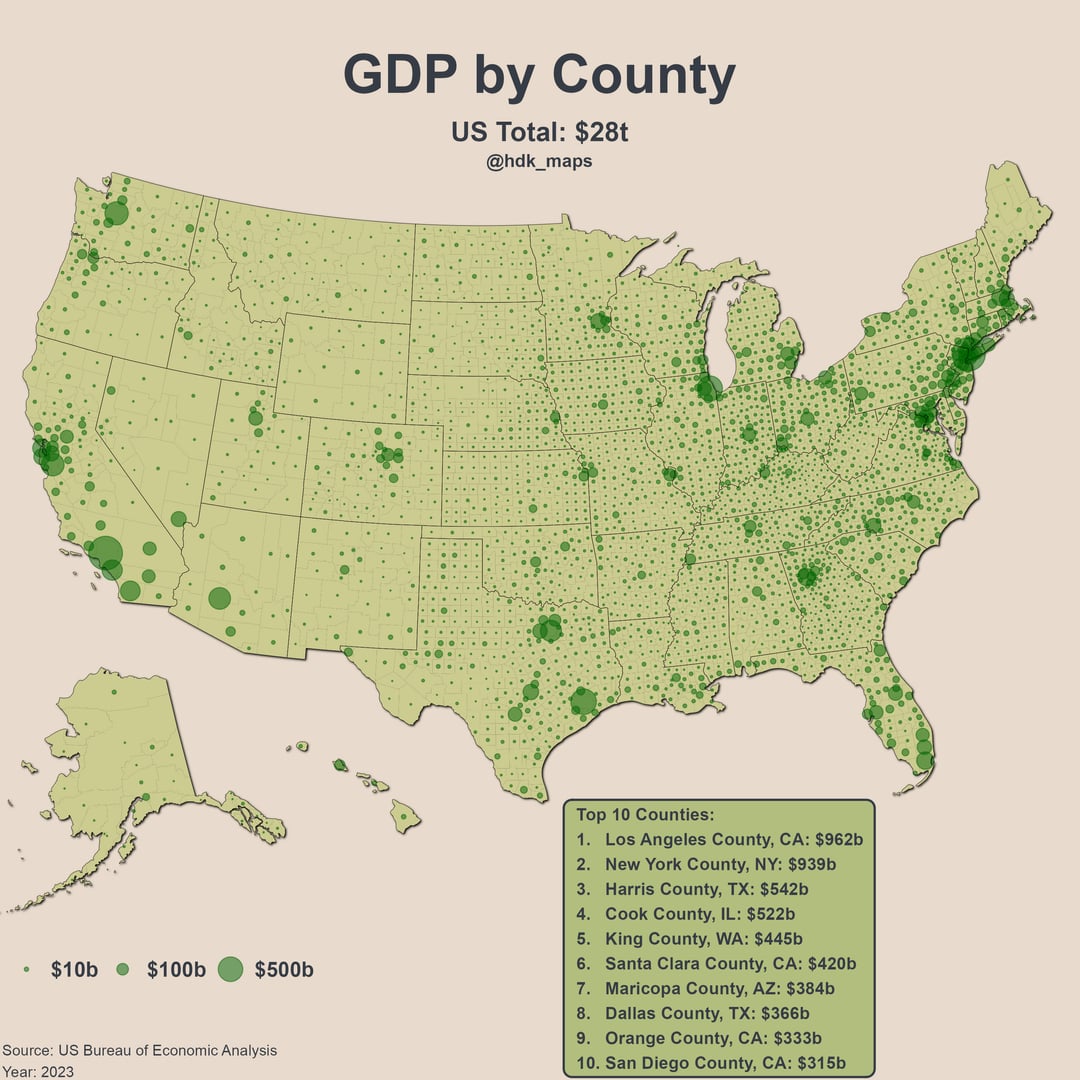
DC to a county makes me slightly question the units here.