

Listening to South Caucasus – Baseline Survey in Georgia
(Sampling Design)
Background
Listening to South Caucasus (L2SC) is an expansion of a collaborative effort conducted across Europe and Central Asia. This initiative aims to comprehensively monitor the views and well-being of a representative group of people as the country introduces social and economic reforms, reaching every business and affecting every citizen. By reflecting on the experience of this group over a year, the study provides an up-to-date understanding of how policies reflect on people’s daily lives.
The study comprises a nationally representative baseline survey of households and a high-frequency panel survey of a subset of the baseline survey. The information collected in the L2SC initiative informs reform efforts directly by (1) raising the profile of citizens’ views and (2) enabling in-depth economic analysis.
After completion of the face-to-face baseline survey, interviewers began regularly calling a randomly selected panel of households over the phone to conduct short interviews, following a monthly schedule agreed upon by the participating households. The questionnaire for these phone interviews was designed to monitor trends in income and savings, subjective well-being, public perception, employment, migration, and indicators related to shocks. Phone-based interviews are conducted monthly for a year.
Sample Design
This note briefly describes the sampling design of the baseline L2SC survey conducted in Georgia, or Listening to Georgia (L2Geo). The design optimizes the spatial allocation of the household sample to provide valid representativeness for the national level, urban and rural areas, and each administrative region.
A two-stage stratified sampling design is employed to select participating households to ensure a balanced sample distribution across regions and account for differences between urban and rural areas, survey budgets, and discrepancies in population estimates. The design closely followed the protocols applied to Living Standards Measurement Study (LSMS) type surveys. In the first stage, a certain number of primary sampling units (PSUs) will be selected in each urban and rural stratum (urban and rural areas within each administrative region). Then, the ultimate sampling units or the secondary sampling units (SSUs), i.e., households in the case of L2Geo, will be randomly selected within each PSU in the second stage. The survey is then implemented among the selected households.
Sampling Frame
The L2Geo employs the national sampling frame based on the 2014 Census, in which the smallest geographic unit is the enumeration areas (EAs). The population has been updated by 2022 using the population growth rate at the municipality-urban/rural level, calculated using data from the National Statistics Office of Georgia (GeoStat). The sampling frame based on EAs allows for a precise formulation of an optimal sample design.
Sample Allocation
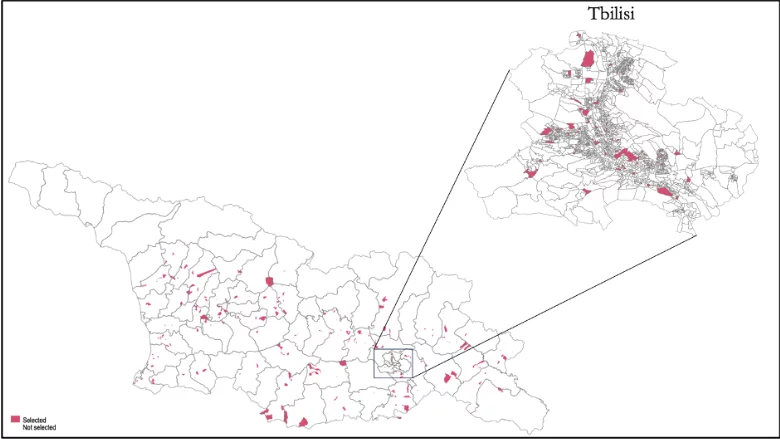
The objective of any sampling design is to extract the most precision in indicators of interest given survey parameters. Thus, the sampling design seeks to find the most optimal design that efficiently allocates the given PSUs across strata and given households across PSUs. For L2Geo, 400 PSUs are randomly selected across strata—urban and rural areas within each region—in the first stage of the two-stage sampling design via systematic random sampling with probability proportional to size (PPS, i.e., implicit allocation), with some adjustments. The PPS method systematically assigns each PSU’s likelihood of selection to the percentage of the PSU’s size in the stratum. For L2Geo, the population is used to measure the size due to a lack of data on the number of households at the PSU level. Thus, the PSU’s likelihood of selection is equal to the percentage of the stratum population residing in the PSU. Figure 1 illustrates the distribution of selected or targeted (panel a) and surveyed (panel b) PSUs. While the randomly selected 400 PSUs have been targeted, the survey has been collected from 396 PSUs. The remaining four PSUs are from Imereti (three PSUs) and Racha-Lechkhumi and Kvemo Svaneti (one PSU) regions.
Figure 1: Spatial distribution of selected PSUs in Georgia
(a) Target
(b) Actual
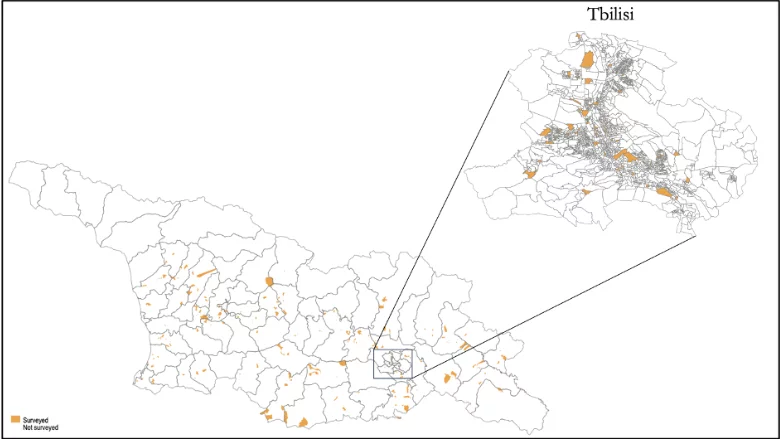
Notes: Panel (a) plots the distribution of randomly selected 400 PSUs in Georgia (132 in Tbilisi), while panel (b) displays the distribution of 396 PSUs (132 in Tbilisi) covered by the survey.
In the second stage, 10 households are randomly selected with equal probability from each chosen PSU. Due to the absence of detailed administrative data and a complete list of households or dwellings for each PSU, a “random walk” approach has been used to select the households within each PSU. Table 1 presents the targeted sample allocation in the first and second stages.
Table 1: Baseline sample design based on proportional sample allocation (Target)
First-Stage Sample
Second-Stage Sample
Region
Total
PSUs
Urban PSUs
Rural
PSUs
Total households
Urban households
Rural households
Tbilisi
132
129
3
1320
1290
30
Adjara A.R.
38
22
16
380
220
160
Guria
11
3
8
110
30
80
Imereti
50
25
25
500
250
250
Kakheti
33
8
25
330
80
250
Kvemo Kartli
47
21
26
470
210
260
Mtskheta-Mrianeti
10
2
8
100
20
80
Racha-Lechkhumi and Kvemo Svanet
4
2
2
40
20
20
Samegrelo – Zemo Svaneti
32
13
19
320
130
190
Samtskhe-Javakheti
16
6
10
160
60
100
Shida Kartli
27
11
16
270
110
160
Total
400
242
158
4000
2420
To produce an efficient sample allocation, it is necessary to understand the target populations by calculating the intra-cluster correlation and the relative standard error (RSE) for selected indicator(s) of interest, such as per capita consumption. The indicator could be any proxy of a welfare measure. The intra-cluster correlation is a measure of the degree of homogeneity for units of analysis within a given area, i.e., households in a cluster. The level of variation between units of analysis is a key factor in the efficiency and precision of a sample. In general, the more similar the units of analysis are within a given area, the higher the design effects and the higher the error. Increasing the number of units of analysis that are relatively homogeneous in a given area further amplifies the loss of precision. The intra-cluster correlation of an indicator of interest x for the unit of analysis j in cluster c is calculated as:
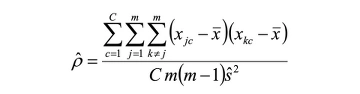
where ρ is the intra-cluster correlation coefficient, C is the total number of clusters in the region, m is the total number of units per cluster, and s is the standard deviation of x from the cluster average. The intra-cluster correlation coefficient can subsequently be used as an input to determine the estimated standard error from a given sample design. We can determine the error of a two-stage sample design as:
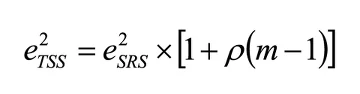
where (1+ρ(m-1)) is the design effects in a clustered sampling design, which include both the cluster size and intra-cluster correlation . The existing data, ideally a survey sample with a similar design that employs the same national sampling frame, must be used to reveal the nature of the intra-cluster correlation and analyze the design effect and RSE. Although there are household surveys, such as the Household Income and Expenditure Survey (HIES) that are based on the 2014 General Population Census frame, identification of sample designs, such as the PSU identification (e.g., codes, names, or geographic location), is not publicly available. This limitation undermines the potential use of those datasets for examining the RSE. So, given the successful completion of the L2Geo baseline survey that reports all information necessary for identifying the sampling design, we check the sample representativeness and examine the sample allocation using the collected baseline data.
Since the sample has already been allocated across the 22 strata for the L2Geo baseline, we calculate the RSE for the chosen sample allocation to show the representativeness. Table 2 presents the actual sample allocation and representativeness of the L2Geo baseline sample in terms of RSE at the national, urban/rural, regional, and stratum levels. The baseline sample size is 3771 households, smaller than the targeted size of 4000 households, primarily due to high non-response rates. Despite the random walk procedure in the second stage, households in the selected PSUs are exhausted before reaching the target of 10 households in the PSU because of the non-responses.
The design effect (DEFF) is typically 1 for simple random sampling, indicating that sampling with a unit design effect is close to random sampling. Given that the calculated DEFF is approximately 1 at all levels, the L2Geo baseline sample is almost as good as random. The sample allocation is evaluated based on the resulting RSE, which is the standard error of the estimate relative to the mean and allows for the comparison of precision. Generally, the lower the RSE, the better the precision, and a 10 percent maximum is commonly recognized as the maximum acceptable RSE. The L2Geo baseline sample is thus representative at the national and urban/rural levels and is not representative at the regional and stratum levels.
Table 2: Actual sample allocation, design effect, and representativeness
Baseline
Number of PSUs
Average cluster size
Number of HHs
DEFF
RSE
National
396
9.5
3771
1.01
2.5%
Urban/rural
Urban
241
9.4
2276
1.01
2.5%
Rural
155
9.6
1495
1.01
4.4%
Region
Tbilisi
132
9.2
1219
1.00
3.3%
Adjara A.R.
38
9.8
373
1.01
5.7%
Guria
11
9.7
107
1.00
17.9%
Imereti
47
10.0
470
1.00
5.1%
Kakheti
33
10.0
330
1.01
10.0%
Kvemo Kartli
47
8.9
418
1.01
5.0%
Mtskheta-Mrianeti
10
9.5
95
1.00
12.2%
Racha-Lechkhumi and Kvemo Svaneti
3
10.0
30
1.00
14.1%
Samegrelo – Zemo Svaneti
32
10.0
320
1.02
8.5%
Samtskhe-Javakheti
16
8.7
139
1.00
10.0%
Shida Kartli
27
10.0
270
1.02
10.0%
Stratum
Tbilisi – Urban
129
9.2
1189
1.00
3.4%
Tbilisi – Rural
3
10.0
30
1.02
13.6%
Adjara A.R. – Urban
22
9.8
215
1.01
7.4%
Adjara A.R. – Rural
16
9.9
158
1.01
8.9%
Guria – Urban
3
9.3
28
1.00
44.0%
Guria – Rural
8
9.9
79
1.00
15.3%
Imereti – Urban
24
10.0
240
1.00
8.2%
Imereti – Rural
23
10.0
230
1.00
5.5%
Kakheti – Urban
8
10.0
80
1.01
13.1%
Kakheti – Rural
25
10.0
250
1.01
11.8%
Kvemo Kartli – Urban
21
9.2
194
1.01
6.6%
Kvemo Kartli – Rural
26
8.6
224
1.00
7.5%
Mtskheta-Mrianeti – Urban
2
10.0
20
1.00
17.8%
Mtskheta-Mrianeti – Rural
8
9.4
75
1.00
14.6%
Racha-Lechkhumi and Kvemo Svaneti – Urban
2
10.0
20
1.00
12.1%
Racha-Lechkhumi and Kvemo Svaneti – Rural
1
10.0
10
N/A
N/A
Samegrelo – Zemo Svaneti – Urban
13
10.0
130
1.01
11.1%
Samegrelo – Zemo Svaneti – Rural
19
10.0
190
1.02
10.2%
Samtskhe-Javakheti – Urban
6
8.3
50
1.01
8.4%
Samtskhe-Javakheti – Rural
10
8.9
89
1.00
13.2%
Shida Kartli – Urban
11
10.0
110
1.00
8.0%
Shida Kartli – Rural
16
10.0
160
1.02
11.8%
Notes: PSUs = primary sampling units, HHs = households, DEFF = design effect, and RSE = relative standard error.
Weights
Sampling weights are necessary when computing representative statistics, as the weights account for the fact that different population members have different probabilities of being selected for interviews. Sampling weights are also adjusted, accounting for non-response rates given the survey design, if necessary.
There will be two sets of weights in the dataset:
- Household weights
- Individual weights
Household weights are the inverse probability of selection of households and are calculated from the following two components in our two-stage sampling design:
- Sampling weight (inverse probability of selection) of the PSU within the stratum,
- Sampling weight (inverse probability of selection) of the selection of a household within the PSU.
For calculating individual weights, we add the following third component to the calculation of the household weights:
3. Sampling weights (inverse probability of selection) of individuals within the household.
Each of the components is calculated as follows:
Component 1. The inverse probability of selection of PSU within the stratum by using PPS is calculated as:
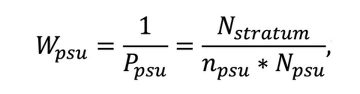
where
W_psu is the sampling weight of PSU within the stratum,
P_psu is the probability of selection of PSU within the stratum,
n_psu in the number of selected PSUs within the stratum,
N_psu is the size of the selected PSU,
N_stratum is the size of the stratum.
Component 2. The inverse probability of selection of a household within PSU is calculated as:
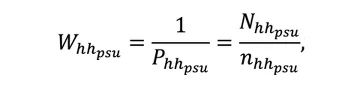
W_(hh_psu ) is the sampling weight of the household within PSU,
P_(hh_psu ) is the probability of selection of household within PSU,
n_(hh_psu ) is the number of sampled (interviewed) households within PSU,
N_(hh_psu ) is the total number of households within PSU.
Component 3. The inverse probability of selection of individual within the household is calculated by:
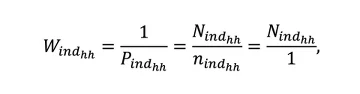
W_(ind_hh ) is the sampling weight of the individual within the household,
P_(ind_hh ) is the probability of selection of individual within the household,
n_(ind_hh ) is the number of sampled (interviewed) individuals within the household, equal to 1, as only one individual was allowed to be interviewed from each household,
N_(ind_hh ) is the size of the household surveyed (asked and recorded during the interview).
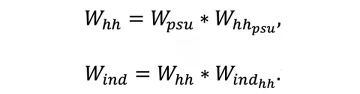
Based on these components, household and individual weights are calculated as:
Conclusion
This note briefly describes the sampling method used for the baseline survey of the Listening to South Caucasus (L2SC) in the Republic of Georgia. The design optimally allocates the sample to satisfy an acceptable precision and statistical efficiency. Using the proposed stratified two-stage sampling design stands to provide valid survey estimates. It depends on the accuracy of the sample design and the selection of PSUs and households at every phase. Identification of the sample design, including stratum identification, PSU identification, household identification, and survey weights, is included in the final datasets.