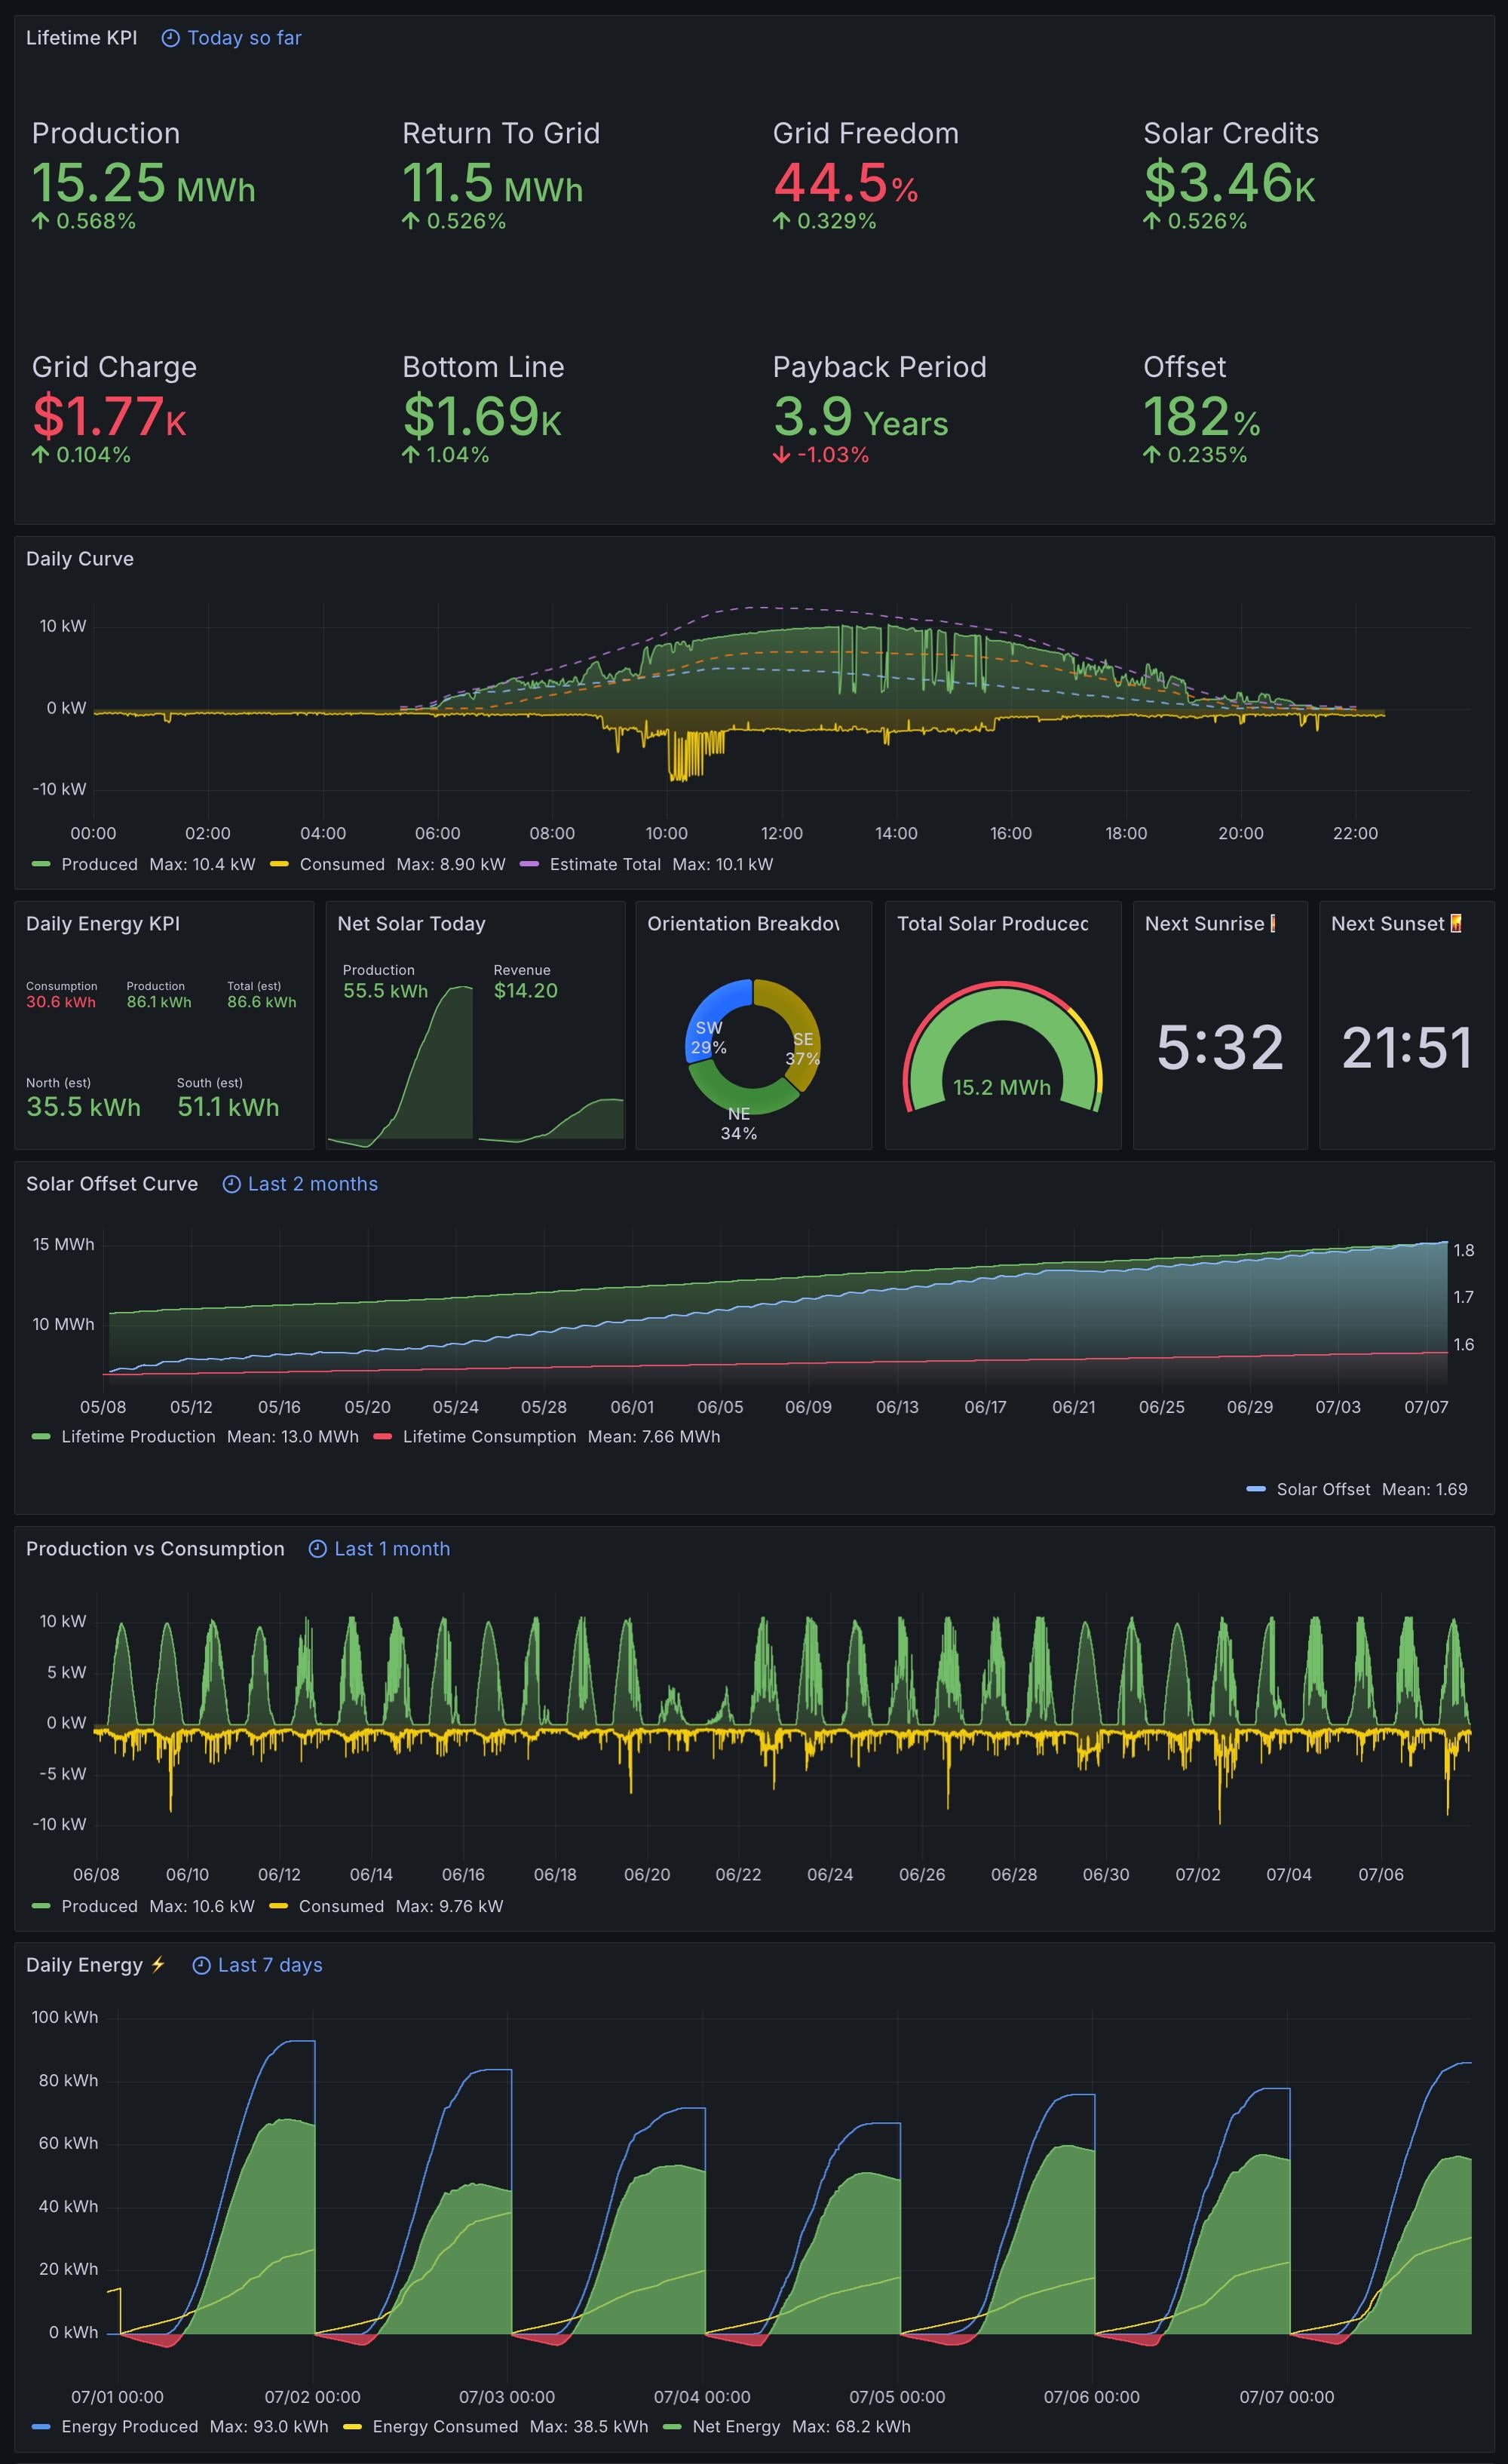
I’ve now completed the first year of the installation. Some key findings:
1. The installer quoted me 14.81 MWh of total generation in year 1. I’ve done 15.25 MWh. Roughly 3% over. The estimation software used was Aurora Solar. PVWatts also quoted a similar number.
2. North facing panels (assuming you’re in the northern hemisphere) do actually make a huge difference. As you can see, roughly 34% of the generation came from them, which is significant.
3. IMO Payback period is a number that isn’t a constant. Your usage habits will change how soon your system is paid off. We started with roughly 6 years but have managed to reduce it down to just under 4 years at this point.
cheff546 on
Gotta be a high sun exposure area for that kind of quick payback.
jaylw314 on
Geez, that’s a busy pic. Reminds me of Jon Bois’ Chart Party videos
RomanEmpire314 on
What area are you in that leads to that solar production?
jinjuu on
Beautiful Grafana dashboards. How are you getting the theoretical max production values? They seem to fluctuate so it looks like it takes in some data in accordance to weather, etc?
halberdierbowman on
For the orientation breakdown, do you have the same capacity installed in each orientation? Like exactly ten identical panels in each orientation, so that the difference here is entirely due to their direction?
If not, I’d be curious to see those numbers divided per panel, to compare if a south facing panel is getting 1MWh vs a North facing panel is getting 0.8MWh for example.

![[OC] First year of residential solar](https://www.byteseu.com/wp-content/uploads/2025/07/yfamjau88qbf1-940x1536.jpeg "[OC] First year of residential solar")
8 Comments
Return time looking great! Wish u the best and may your government/provider not fuck your plans.
Where do you get this readout from?
Hello everyone! I previously posted about my solar system dashboard [here](https://www.reddit.com/r/solar/comments/1eyardo/the_real_reason_to_get_solar_is/) and got lots of great feedback on how to improve the dashboard.
I’ve now completed the first year of the installation. Some key findings:
1. The installer quoted me 14.81 MWh of total generation in year 1. I’ve done 15.25 MWh. Roughly 3% over. The estimation software used was Aurora Solar. PVWatts also quoted a similar number.
2. North facing panels (assuming you’re in the northern hemisphere) do actually make a huge difference. As you can see, roughly 34% of the generation came from them, which is significant.
3. IMO Payback period is a number that isn’t a constant. Your usage habits will change how soon your system is paid off. We started with roughly 6 years but have managed to reduce it down to just under 4 years at this point.
Gotta be a high sun exposure area for that kind of quick payback.
Geez, that’s a busy pic. Reminds me of Jon Bois’ Chart Party videos
What area are you in that leads to that solar production?
Beautiful Grafana dashboards. How are you getting the theoretical max production values? They seem to fluctuate so it looks like it takes in some data in accordance to weather, etc?
For the orientation breakdown, do you have the same capacity installed in each orientation? Like exactly ten identical panels in each orientation, so that the difference here is entirely due to their direction?
If not, I’d be curious to see those numbers divided per panel, to compare if a south facing panel is getting 1MWh vs a North facing panel is getting 0.8MWh for example.