
Our follow-up study involved 69 intensive care unit patients admitted between February 13 and June 22, 2023, with oropharyngeal and rectal swab samples collected every three days. Inclusion criteria required adult patients who died in the ICU and had an anticipated stay of at least 48 h. From the 20 deceased patients (13 males, 7 females), with an average age of 69.8 ± 9.9 years (71 ± 10.8 years for female, and 69 ± 9.8 years for male patients) and a median hospital stay of 12.1 days (range: 2–35 days), samples were divided into two cohorts: postadmission and antemortem, with the latter collected on the day of their death or 1–2 days prior (Fig. 1a and b). Samples were collected from the Vas County Markusovszky University Teaching Hospital, Central Anesthesiology and Intensive Patient Care Department, Szombathely, Hungary. Treatment during hospitalization included mechanical ventilation for all deceased patients upon ICU admission. Medical histories revealed various pre-existing conditions, with 10 patients having cardiovascular, 9 patients having lung diseases, and 16 patients also suffering from hypertension. The majority of admissions (70%) were due to pulmonary issues like chronic obstructive pulmonary disease (COPD) and pneumonia. 11 patients (55%) were diagnosed with sepsis, leading to septic shock in 10 patients (Fig. 1c). Additionally, four medical workers – two nurses and two doctors (three males and one female) – participated in the study, collecting samples and providing continuous patient care throughout the follow-up period. Their average age was 48 ± 7.39 years. Moreover, environmental samples were obtained using specimen collection swabs from various surfaces such as bedrails, handwashing facilities, sinks, hospital spouts, taps, Astrup devices, Continuous Renal Replacement Therapy (CRRT) equipment, nurse’s stations, keyboards, telephones, airlock buttons, GE Healthcare ultrasound system, door handles, rapid tests (glucose, lactate), desks, storage rooms, laboratories, and patient rooms. In total, 23 environmental samples were collected (see Supplementary File 1). The patient cohort partially overlaps with our previously published study35; however, the current investigation expands upon it by including healthcare personnel and environmental sampling, and applies a distinct analytical framework focused on antimicrobial resistance dynamics.
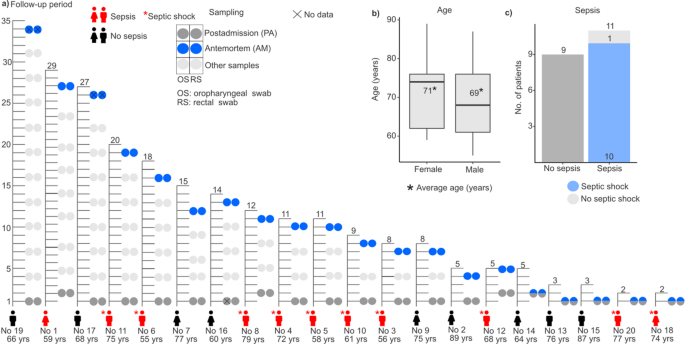
Overview of the study cohort. (a) The figure presents data from 20 patients included in the study, detailing their gender, age, presence of sepsis or septic shock, and ICU length of stay until death. It also illustrates the timeline of simultaneous oropharyngeal (OS) and rectal swab collections (RS), distinguishing between postadmission (PA) and antemortem (AM) samples to track changes throughout their ICU stay and near the time of death. (b) Boxplot illustrates the age of patients based on gender, with an asterisk indicating the mean age (years) of each group. (c) Bar plot shows the number of patients without and with sepsis.
Antibiotic usage in the study group
In our study cohort, antibiotic treatments varied: monotherapy was administered to five patients (25%), dual therapy to ten patients (50%), four patients (20%) received a combination of monotherapy, dual therapy, and triple therapy, and there was one patient (5%) who received no antibiotic therapy during their hospitalization. Antibiotic administration was according to established guidelines41, and in every case, the recommended maximal dosages were ensured for optimal therapeutic efficacy.
Distribution of antimicrobial resistance and multidrug-resistant bacteria across ICU environments, patients, and healthcare staff
A cluster analysis was conducted to clarify the codependent patterns in antimicrobial resistance across microbiota from various sources of the hospital environment in the ICU, as well as those of healthcare professionals and critically ill patients, with a special focus on different anatomical sites, such as the oropharynx and rectum (Fig. 2a).
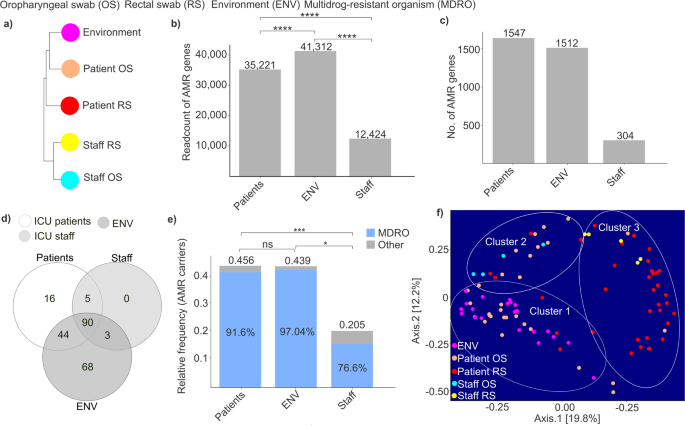
Illustration of the interrelation between taxonomy and resistome data of microbiota from various sources. (a) Cluster analysis shows how different sample types relate to each other. Sample types: environment (ENV), patient’s oropharyngeal (OS), and rectal swab (RS), and medical staff’s oropharyngeal, and rectal swab samples. (b) Bar plots represent the read count of antimicrobial resistance (AMR) genes in different groups: patients, environment, and medical staff. (c) Bar plots show the number of AMR genes in different groups: patients, environment, and medical staff. (d) A Venn diagram estimates the variety of shared and unique AMR-associated pathogens among healthcare staff, critically ill patients, and the ICU environment. (e) Bar plots represent the relative frequency of AMR carriers in different groups: patients, environment, and medical staff. (f) PCoA plots were created to investigate potential clustering pattern similarities based on data of multidrug-resistant organisms (MDROs), between different sample types, described previously. Each point is a single sample and the distance between them is proportional to the difference. Asterisks indicate significant differences (*p < 0.05, ***p < 0.001, ****p < 0.0001).
Our analysis revealed that the environment had the most distinct composition of AMRs, yet it also showed the most similarity to patient microbiota, particularly to oropharyngeal swabs (OS), followed by rectal swabs (RS).
We assessed how the read count of AMR genes varied across our experimental groups (Fig. 2b). Our findings revealed that the highest read counts were observed in ICU environmental samples, which were significantly higher compared to both patient and staff samples (Wilcoxon rank-sum test, Environment AMR read count: 41,312 vs. Patient AMR read count: 35,221, p-value < 0.0001; Environment AMR read count: 41,312 vs. Staff AMR read count: 12,424, p-value < 0.0001). Additionally, we measured significantly lower read counts in staff samples compared to ICU patient samples (Wilcoxon rank-sum test, Patient AMR read count: 35,221 vs. Staff AMR read count: 12,424, p-value < 0.0001).
When examining the number of different AMR gene types across our groups, we found that staff samples contained the lowest number of AMR variants. ICU patient samples contained 5.08 times higher and environmental samples 4.97 times higher number of AMRs compared to staff samples (Fig. 2c). Meanwhile, patients exhibited higher AMR diversity than environmental samples (Number of AMR genes, patients: 1,547 vs. environment: 1,512).
Another objective was to compare the diversity of antibiotic-resistant organisms (AROs) present in patients, healthcare staff, and the ICU environment, as well as to assess the extent of overlap between these different habitats (Fig. 2d). A Venn diagram was used to identify shared and unique AROs. Among the detected organisms, an exceptionally high proportion (90.71%) of resistance-carrying microbes, based on the CARD database, were found in the environment, with 68 species (30% of the total) being unique. This underscores the ICU environment as a significant reservoir of diverse AMRs. Patient samples contained 68.58% of the identified AROs, with 7% being unique to this group. In contrast, staff samples harbored only 43.36% of the AROs (98 species), none of which were unique. Notably, 90 species, representing 40% of the total detected AROs, were shared across all sample groups. When analyzing the common AROs, the genera Streptomyces and Streptococcus exhibited notably high abundance (Streptomyces: 8 species, Streptococcus: 7 species). At the phylum level, Firmicutes, Proteobacteria, and Actinobacteria dominated the resistome composition, collectively accounting for approximately 69% of all identified shared AROs (Firmicutes: 27 species, Proteobacteria: 19 species, and Actinobacteria: 16 species).
Examining the relative prevalence of AMR-carrying species, we found that the highest proportion of AROs was observed in patient samples (Fig. 2e). Although a lower prevalence of AROs was measured in the environment, the difference was not statistically significant (Wilcoxon rank-sum, Patients ARO relative frequency: 0.456 vs. environment ARO relative frequency: 0.439, p-value = 0.198). The lowest proportion of AROs was detected in staff samples, which was significantly lower compared to both patient and environmental samples (Wilcoxon rank-sum, staff ARO relative frequency: 0.205 vs. patient ARO relative frequency: 0.456, p-value = 0.0008; staff ARO relative frequency: 0.205 vs. environmental ARO relative frequency: 0.439, p-value = 0.0104). Additionally, we assessed the proportion of AROs classified as multidrug-resistant organisms. Our findings showed that the highest percentage was observed in environmental samples (97.04%), while the lowest was detected in staff samples (76.6%).
The coherence between the assortment of MDROs in various sample groups was then analyzed (Fig. 2f). This investigation examined the distribution and diversity of MDROs across environmental sources and the microbiota of patients and staff, using oropharyngeal and rectal swab samples. The PCoA plot revealed three distinct clusters based on MDRO data: ‘Cluster 1’ included samples from both the environment and patients’ oropharyngeal swabs; ‘Cluster 2’ showed an overlap between staff oropharyngeal, patient oropharyngeal, and patient rectal swabs; and ‘Cluster 3’ displayed overlap between patient oropharyngeal, patient rectal, and staff rectal samples. Patients’ oropharyngeal swabs showed notable MDRO overlap with environmental sources and, to a lesser extent, with staff oropharyngeal samples. Interestingly, while the overlap with environmental samples was substantial, the similarity with staff microbiota, especially rectal samples, was comparatively less noteworthy. Additionally, neither patient nor staff rectal samples showed substantial overlap with environmental MDROs.
Distribution of AMRs associated with healthcare-associated infection-causing pathogens in various resistance reservoirs
Cluster analysis revealed distinct structural patterns in AMR assortments associated with healthcare-associated infection-causing species (Fig. 3a). AMR profiles were most similar among patient-derived oropharyngeal and rectal swabs, while those from asymptomatic healthcare personnel also exhibited strong internal similarity. In contrast, environmental samples showed the greatest divergence from HAI-associated AMRs. Notably, staff-associated AMR profiles resembled greater similarity to environmental samples than to those derived from patients.
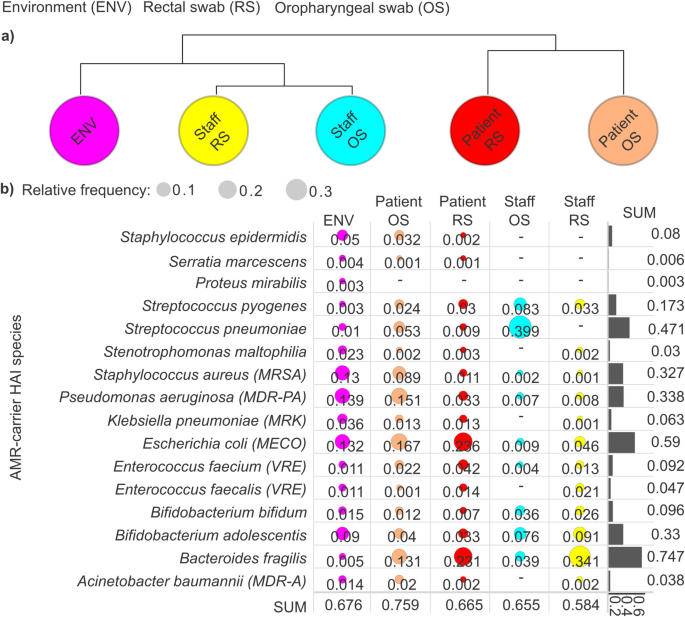
Distribution and prevalence of antimicrobial resistances (AMRs) associated with healthcare-associated infection (HAI)-causing species across sample groups. (a) A cluster map was generated to visualize the relationships between sample groups based on HAI AMR relative abundance data, revealing interconnected patterns among healthcare staff oropharyngeal swabs (staff OS), healthcare staff rectal swabs (staff RS), patient oropharyngeal swabs (patient OS), patient rectal swabs (patient RS), and environmental samples (ENV). (b) Bubble plots display the prevalence of AMR associated with HAI species across sample groups, with bubble diameter proportional to their relative abundance. Bar plots show the cumulative relative frequency of each species across the groups.
We examined the distribution of AMR determinants carried by HAIs-causing species across different sample types, including environmental, patient (oropharyngeal and rectal swabs), and staff microbiome samples (Fig. 3b). Our analysis revealed that HAI-associated AMR occurrence was highest in patient oropharyngeal swabs (0.759), indicating a significant reservoir within this anatomical niche. Environmental samples followed with a cumulative AMR frequency of 0.676, suggesting substantial contamination and potential transmission pathways. Patient rectal swabs exhibited comparable AMR frequencies (0.665), followed by staff oropharyngeal swabs (0.655), reinforcing the hypothesis that asymptomatic healthcare personnel could serve as significant carriers. Notably, the lowest cumulative AMR frequencies were observed in rectal swabs from healthcare staff (0.584).
Across the examined HAI niches, Bacteroides fragilis exhibited the highest AMR association (rf: 0.747), followed by Escherichia coli (rf: 0.59), Streptococcus pneumoniae (rf: 0.471%), Pseudomonas aeruginosa (rf: 0.338), and Staphylococcus aureus (rf: 0.327). Notably, our data revealed that B. fragilis-associated AMRs were most prevalent in staff rectal swabs (rf: 0.341), followed by patient rectal swabs (rf: 0.231) and patient oropharyngeal swabs (rf: 0.131). In contrast, E. coli exhibited the highest AMR frequencies in patient rectal swabs (rf: 0.236), with slightly lower but still considerable prevalence in patient oropharyngeal swabs (rf: 0.167) and environmental samples (rf: 0.132). S. pneumoniae displayed an exceptionally high AMR prevalence in staff oropharyngeal swabs (0.399), while its presence in other niches was markedly lower. In staff rectal swabs, no S. pneumoniae-associated AMR determinants were detected. Among HAI-associated species, E. coli emerged as the dominant AMR carrier in patient oropharyngeal swabs (rf: 0.167), followed by P. aeruginosa (rf: 0.151), B. fragilis (rf: 0.131), and S. aureus (rf: 0.083). In contrast, S. pneumoniae was the predominant AMR-carrying species in staff oropharyngeal swabs.
Identification and comparative distribution of common antimicrobial resistances (CAMRs) across various ICU-associated niches
Common antimicrobial resistances (CAMRs) displaying an above-average relative occurrence were identified (see Supplementary File 2). The CAMRs accounted for 36.1% of all detected resistances (Fig. 4a). CAMRs showed the highest frequency in environmental samples (11.9%), followed by patient samples, where oral swabs exhibited the highest frequencies (9.8%), surpassing the values measured in patients’ rectal swabs (7.8%). The lowest distribution of CAMRs was observed in staff samples, with the lowest values found in their OS samples (2.5%), while slightly higher values were recorded in their RS samples (3.9%).
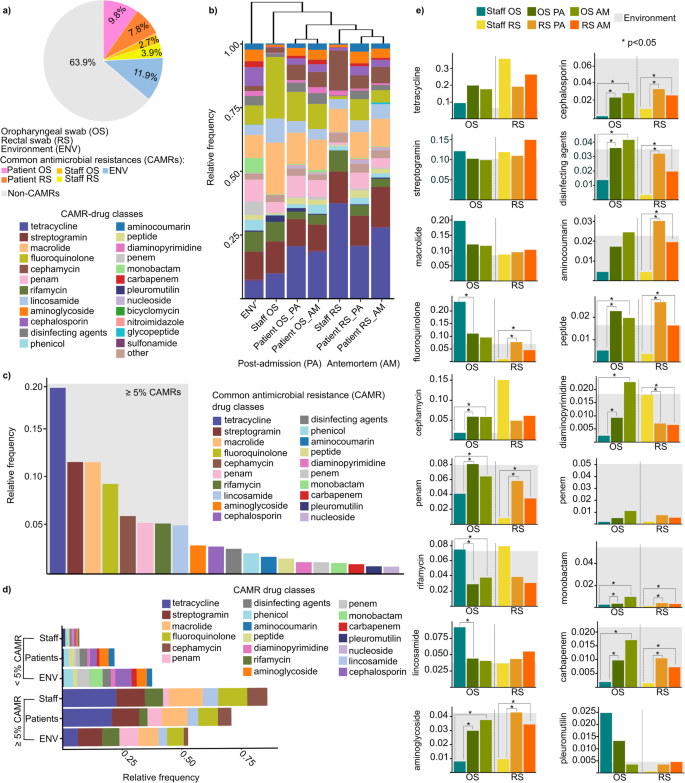
Distribution of common antimicrobial resistances (CAMRs). (a) A pie chart demonstrating the distribution of non-CAMRs and CAMRs in patients’ oropharyngeal and rectal swabs, as well as in the staff’s oral and rectal swabs and in the environment. (b) Clustered stacked bar plot shows patterns and similarities in CAMRs across sample types. (c) Bar plot shows the relative frequency of CAMRs with a relative frequency above and below 5% relative frequency in our study cohort. (d) Stacked bar plots show the distribution of CAMR classes relative frequency across the different sample populations. (e) Differences in the relative distribution of CAMRs associated with staff and patients in both oropharyngeal (OS) and rectal swab (RS) samples were examined, as well as to postadmission (PA) and antemortem (AM) samples. The CAMRs load of the environment were marked with light grey background. In every case, bar plots were used to examine the statistical differences between the sample groups. Asterisks indicate significant difference (*p < 0.05).
Resistance classes associated with the CAMRs were also analyzed (Fig. 4b). Hierarchical clustering was applied to uncover patterns in the respective resistance classes across different sample groups, providing a visual representation of the distribution patterns. The results revealed that environmental samples differed the most from swabs collected from the anatomical sites, such as the oropharynx and rectum. It was estimated that for the CAMRs, the OS samples, particularly those from the healthcare staff, showed the greatest resemblance to the environmental samples. Interestingly, for both anatomical sites, the postadmission (PA) patterns were more similar to the environmental samples than the antemortem (AM) ones. However, a Kruskal–Wallis test did not reveal statistically significant differences in resistance class distributions across the sample groups (χ² = 5.69, p = 0.46).
A distribution diagram was created to display resistance classes by their relative occurrences, highlighting CAMRs with relative frequencies below and above 5% (Fig. 4c). Based on these, tetracycline was the most abundant (rf: 20.7 ± 0.1%) from CAMR-drug classes in our sample cohort, followed by streptogramin and macrolide (streptogramin rf: 12.4 ± 0.02%, macrolide rf: 12.4 ± 0.04%), fluoroquinolone (rf: 10 ± 0.07%), cephamycin (rf: 6.4 ± 0.04%), penam (rf: 5.7 ± 0.03%), rifamycin (rf: 5.6 ± 0.02%), and lastly, lincosamide (rf: 5.4 ± 0.02%). A Kruskal–Wallis test revealed significant differences in the relative frequencies across resistance classes (χ² = 98.57, p < 0.0001), indicating notable variation in the distribution of resistance across the different classes.
When examining CAMRs with frequencies below 5%, contrasting abundance patterns were observed compared to previous findings. The environment showed the highest burden for CAMRs below 5%, while staff samples had the lowest. Conversely, CAMRs with frequencies above 5% were primarily found in staff samples, followed by patient samples, and were least common in environmental samples (Fig. 4d). A Kruskal–Wallis test confirmed that these differences in relative frequencies across sample groups were statistically significant (χ² = 46.16, p < 0.0001).
The magnitude of the differences in the relative frequencies of CAMRs was also calculated statistically by using Wilcoxon rank-sum test (Fig. 4e). Upon analyzing resistance class frequencies, tetracycline had the lowest environmental burden (Environment rf: 0.063) compared to patients and staff (rf: 0.21 ± 0.089), followed by cephamycin (Environment rf: 0.018, others: 0.066 ± 0.045), pleuromutilin (Environment rf: 0.004, others: 0.008 ± 0.0091), and fluoroquinolone (Environment rf: 0.070, others: 0.096 ± 0.077). Despite its low environmental burden, tetracycline showed the highest relative frequencies in patient and staff samples, particularly in staff rectal swabs (rf: 0.35) and patients’ dysbiotic antemortem samples (rf: 0.26). Some resistance classes, such as carbapenem and aminoglycoside, showed significantly lower burdens in staff OS and RS samples despite high environmental loads (carbapenem Staff OS rf: 0.0019 vs. carbapenem OS PA rf: 0.0097, OS AM rf: 0.017, p < 0.05; carbapenem Staff RS rf: 0.0014 vs. carbapenem RS PA rf: 0.010, RS AM rf: 0.0072, p < 0.05; aminoglycoside Staff OS rf: 0.0079 vs. aminoglycoside OS PA rf: 0.030, OS AM rf: 0.037, p < 0.05; aminoglycoside Staff RS rf: 0.0095 vs. aminoglycoside RS PA rf: 0.043, RS AM rf: 0.034, p < 0.05). Among the CAMRs with a frequency greater than 5% relative frequency, we observed lower rifamycin resistance values in both the patients’ OS and RS samples compared to the staff samples, despite the high environmental burden. Additionally, these differences were found to be statistically significant (OS patient PA rf: 0.029, OS AM rf: 0.038 vs. OS staff rf: 0.075, p < 0.05) in the OS samples.
Investigation of the extent of microbial translocation and AMR dynamics in early versus late mortality ICU patients
The Kaplan–Meier estimator was utilized to evaluate patient survival, illustrating survival probabilities across a 0-35-day follow-up period, stratified by patients’ length of hospital stay prior to death (Fig. 5a). The median survival time, defined as the time at which 50% of patients had died, was 10 days (28.6% of the total study duration). Based on this threshold, the patient population was stratified into two groups: those who experienced early mortality (EM), defined as death within 10 days, and those who experienced late mortality (LM), defined as survival beyond 10 days.
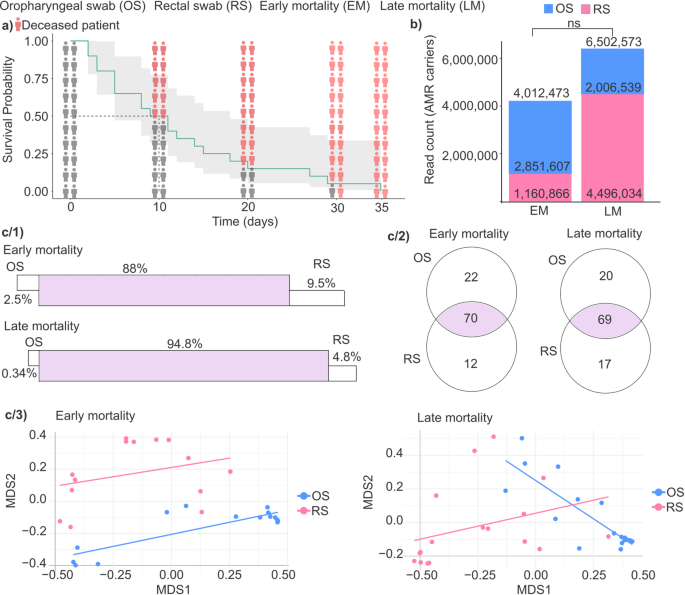
Analysis of survival and antimicrobial resistance in ICU patients. (a) The Kaplan-Meier curve was used to analyze the patient’s death time in our study population. The y-axis shows the survival probability, x-axis the time spent on the ward. The icons show the survival probability on the 0, 10, 20, 30 days. Red icons illustrate the deceased patients. (b) Stacked bar plots represent the antimicrobial resistance (AMR) read count in early mortality (EM) and late mortality (LM) groups. Color represents different anatomical sites (blue OS = oropharyngeal swab, pink RS = rectal swab). (c/1) Panels display the degree of overlap in AMR carrier bacterial taxa between anatomical sites in both early and late mortality groups. (c/2) Venn diagrams illustrate the distribution of AMR carrier bacterial taxa between OS and RS samples within the early and late mortality groups. (c/3) Multidimensional scaling (MDS) plots with linear regression lines were used to visualize the composition of core AMR carrier species in OS and RS samples. NS = not significant.
Subsequently, we determined the read counts of AMR carriers in patient samples from two anatomical regions, the oropharynx and the rectum, to compare the EM and LM groups (Fig. 5b). The cumulative number of AMR read counts was 4,012,473 in the EM group and 6,502,573 in the LM group, representing a 1.62-fold increase in LM patients (Wilcoxon rank-sum test, not significant, p-value = 0.987). Within the OS group, AMR read counts were higher in EM patients, showing a 1.42-fold increase compared to LM patients (Wilcoxon rank-sum test, EM = 2,851,607 vs. LM = 2,006,539, not significant, p-value = 0.496). Conversely, in the RS group, AMR read counts were 3.87 times higher in LM patients than in EM patients (Wilcoxon rank-sum test, EM = 1,160,866 vs. LM = 4,496,034, not significant, p-value = 0.883), also without statistical significance.
The microbial translocation of AMR-carrying species between anatomically distant microbiome sites was investigated by comparing oropharyngeal and rectal swab samples in both the EM and LM patient groups (Fig. 5c). Our findings indicate that the level of bacterial translocation of AMR carrier species was higher in the LM group compared to the EM group (Fig. 5c/1). Specifically, the prevalence of core AMR-carrier species – defined as species detected in both anatomical sites – was higher in the LM group (94.8%) compared to the EM group (88%), suggesting increased microbial exchange between anatomical locations among patients with prolonged survival. Additionally, in both patient groups, rectal swab samples consistently showed a higher proportion of unique species compared to oropharyngeal swab samples. Specifically, in the EM group, unique species were 3.8-fold higher in RS (9.5%) than OS (2.5%), while in the LM group, this difference was even more pronounced, with RS (4.8%) showing 14.1-fold more unique species than OS (0.34%).
Venn diagrams were made to illustrate the variety and the distribution of AMR carrier species between OS vs. RS across the early-mortality and late-mortality patient groups (Fig. 5c/2). In the EM group, 21.2% of the detected species (22 out of 104) were unique to OS samples, while 11.5% (12 out of 104) were exclusive to RS samples, whereas the majority (67.3%, 70 out of 104) of identified species were shared between both anatomical sites, constituting the core AMR carrier microbiome. In the LM group, the proportion of OS-specific species was slightly lower (18.9%, 20 out of 106) compared to the EM group, whereas the proportion of RS-specific species increased to 16.0% (17 out of 106). The proportion of core species common to both OS and RS samples remained similar to that observed in the EM group, at 65.1% (69 out of 106).
Linear regression lines overlaid on MDS plots illustrate the relative compositional relationship between AMR-carrying core microbiota in oropharyngeal and rectal swab samples, highlighting patterns of similarity or divergence in microbial community structure across these anatomically distinct sites (Fig. 5c/3). In the early mortality group, we observed a modest but significant alignment between oropharyngeal and rectal microbiomes along the first MDS axis (MDS1 coefficient = 0.30, p = 0.0099), suggesting a degree of coordination or similarity in AMR carrier distribution across these anatomical sites. Rectal swabs displayed a slight positive trend, potentially indicating that changes in AMR abundance in one site were mirrored in the other, pointing to interdependence between the two microbial communities.
In contrast, the late mortality group exhibited a more complex pattern: oropharyngeal samples showed a strong negative trend along MDS1 (coefficient = −0.91, p = 0.0005), while rectal samples maintained a positive trajectory. A significant interaction term (MDS1:GroupRS = 1.22, p = 0.0003) further supports increased convergence between OS and RS microbiota over time, possibly reflecting enhanced microbial exchange or stabilization of AMR-carrying populations in patients with prolonged ICU stays.
Identification of microbial biomarkers predictive of severe clinical deterioration and early mortality in ICU patients
Although our study cohort exclusively comprised ICU-admitted patients who died during hospitalization, one of our primary objectives was to distinguish patients who experienced early mortality (EM) from those with comparatively longer survival (LM), based on a median survival threshold. Accordingly, we aimed to identify microbial taxa in postadmission oropharyngeal and rectal swab samples that may serve as potential biomarkers of severe dysbiosis, possibly associated with imminent clinical deterioration shortly after ICU admission.
To reliably identify microbial biomarkers predictive of clinical outcomes, our analysis specifically focused on taxa exhibiting relatively high abundance – defined as abundant AMR-carrying microbes with relative abundance > 0.001 (abundant AMR-carriers). Collectively, these taxa accounted for approximately 95% of all detected species in both oropharyngeal swab (OS; relative frequency: 0.952 ± 0.033) and rectal swab (RS; relative frequency: 0.946 ± 0.028) samples (Fig. 6a).
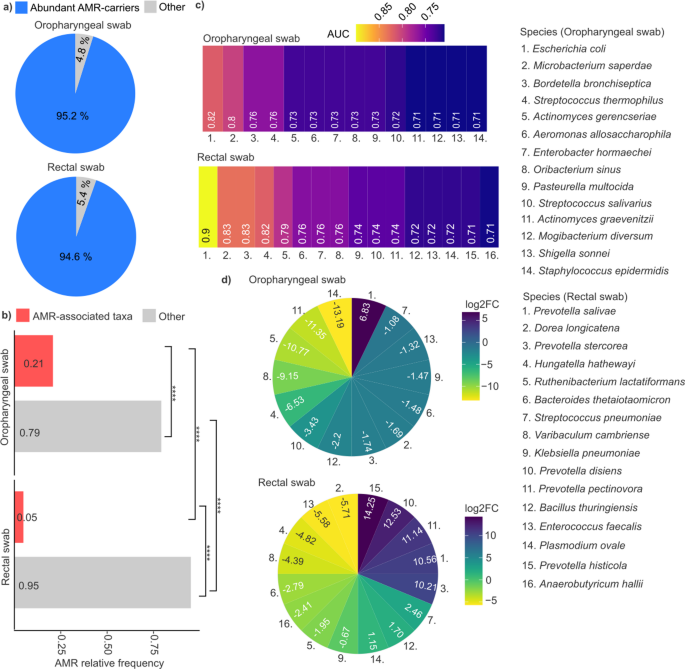
Identification of microbial biomarkers associated with mortality. (a) Pie charts visualize AMR-carrier taxa relative frequency > 0.001 (blue) and relative frequency < 0.001 (grey). (b) Bar plots represent relative frequency of oropharyngeal (OS), and rectal swab (RS) sample. Red bars mean AMR-associated taxa, while grey means non-AMR-associated. (c) Heatmaps visualize Area under curve (AUC) values of oropharyngeal swab, and rectal swab samples. (d) Circular heatmaps represent the logarithm of fold change (log2FC) in oropharyngeal swab, and rectal swab samples. Positive values (blue color) mean more abundant in early mortality samples, and negative values (yellow color) mean more abundant in late mortality samples. Species are listed on the right side, for both oropharyngeal and rectal swab samples. Asterisks indicate significant differences (**** p < 0.0001).
Receiver operating characteristic (ROC) curves were generated to evaluate the discriminative power of abundant AMR-carrier biomarkers in distinguishing ICU-admitted patients with early mortality (survival < 10 days, n = 10) from those with late mortality (survival up to 35 days, n = 10). To achieve this, relative abundance data from postadmission swab samples were converted into binary variables reflecting prospective clinical outcomes (EM vs. LM), and the area under the curve (AUC) was calculated to identify microbial taxa with the highest prognostic potential (Supplementary File 3).
Subsequently, taxa with high relative abundance (rf > 0.001) and strong discriminatory power (AUC > 0.7) were identified. The relative frequency of AMR-associated taxa was significantly higher in OS compared to RS samples, representing a 4.2-fold difference (Wilcoxon rank-sum test, OS rf: 0.21 vs. RS rf: 0.05, p < 0.0001) (Fig. 6b). Fourteen such taxa were detected in OS samples, whereas sixteen were found in RS samples (Fig. 6c). Notably, taxa from RS samples exhibited generally stronger discriminatory power, including Prevotella salivae (AUC = 0.9), Dorea longicatena (AUC = 0.83), Prevotella stercorea (AUC = 0.83), and Hungatella hathewayi (AUC = 0.82). Overall, the mean AUC of the top four microbial biomarkers was higher in RS (0.85 ± 0.04) than in OS samples (0.78 ± 0.03).
Subsequently, taxa exhibiting significant differences in relative abundance between EM and LM patients were identified by calculating the log₂ fold-change (EM/LM) based on postadmission swab samples (Fig. 6d). In oropharyngeal samples, Escherichia coli showed the highest increase (log₂ fold-change: 6.82) in EM compared to LM patients. In rectal swabs, the most pronounced increases in EM patients were observed for Prevotella histicola (log₂FC = 14.25), P. disiens (log₂FC = 12.53), P. pectinovora (log₂FC = 11.14), P. salivae (log₂FC = 10.56), and P. stercorea (log₂FC = 10.56). In contrast, the greatest decreases occurred in Dorea longicatena (log₂FC=−4.82), Hungatella hathewayi (log₂FC=−4.82), Varibaculum cambriense (log₂FC=−4.39), and Enterococcus faecalis (log₂FC=−5.58) in EM relative to LM patients.
Identification of multidrug-resistant organisms as early biomarkers for sepsis in ICU patients
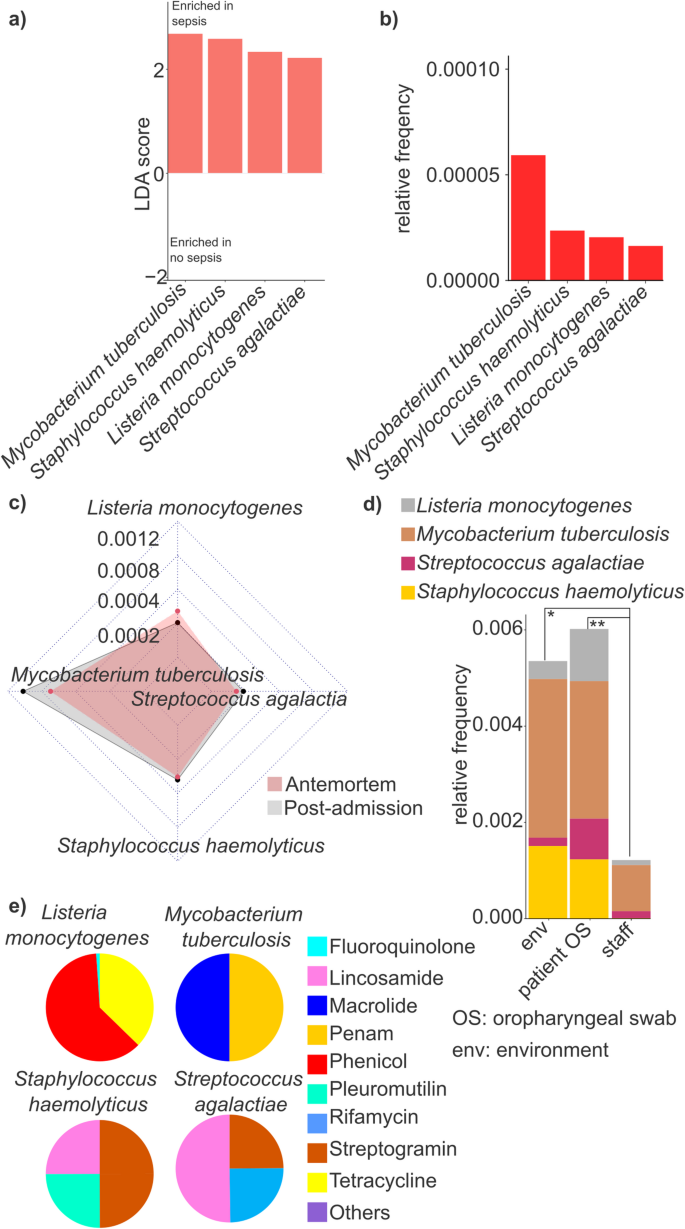
In this study, we also aimed to identify MDROs in postadmission samples from ICU patients as potential early biomarkers predictive of sepsis development. For these Linear Discriminant Analysis Effect Size (LEfSe) was applied to identify microbial taxa significantly enriched in PA samples from patients who subsequently developed sepsis (10 patients, comprising 50% of the cohort, who ultimately succumbed to septic shock) compared to those who remained sepsis-free (10 patients, 50% of the cohort). Although our analyses included both oropharyngeal swab and rectal swab samples, only OS samples yielded taxa with an LDA score greater than 2 (Fig. 7a). Accordingly, four multidrug-resistant organism species – Listeria monocytogenes, Mycobacterium tuberculosis, Staphylococcus haemolyticus, and Streptococcus agalactiae – were found to be significantly enriched in postadmission samples of septic patients.
Comparison of taxonomic differences and antimicrobial associations in sepsis and non-sepsis samples. (a) Bar plots represent the Linear discriminant analysis (LDA) score > 2 values taxons between sepsis and no sepsis samples. (b) The relative frequencies of these bacteria were visualized with bar plots. (c) Radar chart was used to estimate the differences between postadmission and antemortem samples regarding the selected taxons. (d) The distribution of the selected taxons was checked in different sample types. (e) Pie charts were used to visualize the 9 antimicrobial classes that related to the selected taxons. Asterisks indicate significant difference (* p < 0.05, **p < 0.01).
The relative abundance of these species was quantified, revealing that M. tuberculosis exhibited, on average, a 2.61-fold, significantly higher prevalence compared to the other species (Wilcoxon rank-sum test, M. tuberculosis rf: 0.000055 ± 0.000021 occurrence vs. the average of others: 0.000017 ± 0.000013; p-value = 0.0044) (Fig. 7b).
Next, the differences in the presence of these species between PA and AM samples were examined, focusing solely on OS samples (Fig. 7c). Interestingly, no significant differences were observed between PA and AM samples for L. monocytogenes (Wilcoxon rank-sum test, AM rf: 0.00041, PA rf: 0.00031, p > 0.05), S. agalactiae (Wilcoxon rank-sum test, AM rf: 0.00022, PA rf: 0.00028, p > 0.05), and S. haemolyticus (Wilcoxon rank-sum test, AM rf: 0.00045, PA rf: 0.00048, p > 0.05). However, a slightly elevated relative abundance of M. tuberculosis was detected in PA samples (AM rf: 0.00082, PA rf: 0.0011), although these differences were not statistically significant (Wilcoxon rank-sum test, p > 0.05).
The relative abundance of these species across different sample populations was further analyzed, revealing that the cumulative relative abundance of the four sepsis-enriched MDRO species was highest in OS samples from patients (rf sum: 0.0060, mean: 0.0015 ± 0.00091, p-value = 0.009), followed by the ICU environment (rf sum: 0.0052, mean: 0.0013 ± 0.0014, p-value = 0.02), in comparison with staff samples (rf OS combined: 0.0060 vs. staff) (Fig. 7d).
Finally, the resistance classes associated with sepsis-specific species were examined (Fig. 7e). Notably, considerable variation was observed in the distribution of resistance classes. Nine major resistance classes were identified, with M. tuberculosis exhibiting the highest number of associated AMR determinants, which were categorized into only two major classes: macrolides (50.0%) and penams (50.0%). Similarly, L. monocytogenes was linked to two main resistance classes, with phenicols being overwhelmingly dominant (61.6%), followed by tetracyclines (37.3%). In contrast, S. haemolyticus and S. agalactiae were associated with three major resistance classes, respectively, with lincosamides and streptogramin being common to both (S. haemolyticus: lincosamide 25.0%, pleuromutilin 25.0%, streptogramin, 50.0%; S. agalactiae: lincosamide: 50.0%, rifamycin, streptogramin each 25.0%).
Patterns of antibiotic use and their association with newly emerged resistances
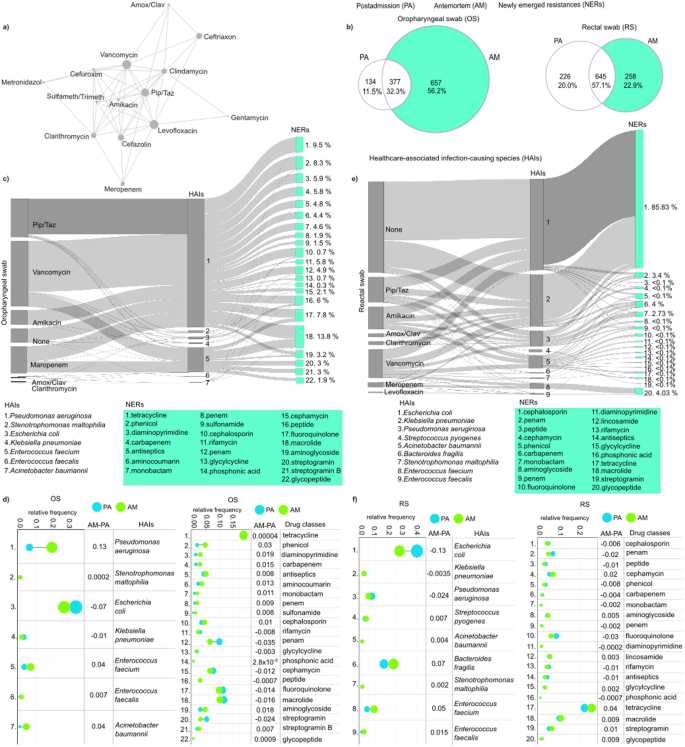
A network diagram was designed to illustrate the antibiotics, and their combinations used throughout the follow-up period (Fig. 8a). The most frequently used antibiotics included vancomycin, levofloxacin, and piperacillin/tazobactam, often administered as part of combination therapies. In contrast, gentamicin and metronidazole were among the least commonly used antibiotics.
Antibiotic combination regimes and the development of newly emerged resistances (NERs). (a) A network illustrating the antibiotics, and their combinations utilized throughout the study period. Nodes symbolize antibiotics, with their size proportional to the extent of their use, while edges indicate their use in combination therapies. (b) Venn diagrams illustrating the number of newly acquired resistances in patients’ antemortem (AM) samples from oropharyngeal swabs (OS) and rectal swabs (RS). Sankey diagrams showing newly emerged resistance classes and their association with healthcare-associated infection (HAI)-causing species in patients’ (c) oropharyngeal and (e) rectal swabs. Relative frequency data showing the average distribution of NER-carrying species and the carried drug classes throughout our entire population in both our (d) OS and (f) RS sample groups.
The occurrence of newly emerged resistances (NERs) in antemortem oropharyngeal and rectal swabs was also investigated. Based on in silico data, Venn diagrams revealed that a substantial proportion (56.25%) of the different types of resistances identified in microbiomes from oropharyngeal swabs were newly emerged indicating that these resistances were only detectable in the patients’ antemortem microbiomes. (Fig. 8b). The proportion of newly acquired resistances in the rectal swab microbiomes was significantly lower, at about half the rate, 22.85%.
The potential association between antibiotic use, newly emerged resistances, and the corresponding healthcare-associated infection-causing species was also investigated (Fig. 8c and e). In oropharyngeal swab samples, Pseudomonas aeruginosa and Enterococcus faecium were identified as the primary species associated with the highest proportion of newly emerged resistances (81.26% and 16.7% of total), while Escherichia coli and Stenotrophomonas maltophilia also exhibited remarkable gain in the different NERs (Fig. 8c). For P. aeruginosa, the NERs were most frequently related to treatment with vancomycin in the form of combination therapy, and to a lesser extent, piperacillin-tazobactam. In instances of E. faecium, the development of resistances was predominantly observed against macrolides, fluoroquinolones, streptogramins, and glycopeptides, which are commonly linked with the use of vancomycin and meropenem treatments in combination therapy. In our patient cohort, E. coli was the most abundant species in both sample populations taken postadmission and antemortem (Fig. 8d and f). Its relative abundance showed a moderate decrease during the hospital stay (from OS PA rf: 0.33 to OS AM: 0.26, from RS PA: 0.40 to RS AM: 0.27) (Fig. 8d and f). Among the NERs, in oropharyngeal swab samples, macrolide was the most abundant (13.8%), followed by tetracycline (9.5%) and phenicol (8.3%) (Fig. 8c). Across our entire patient cohort, tetracycline was by far the most abundant drug class (19.01%) and showed no change between the antemortem samples and the postadmission samples (Fig. 8d). In rectal swabs, among the NERs, cephalosporin was by far the most abundant resistance (85.83%) with the largest portion of these resistances associated with Escherichia coli, followed by Klebsiella pneumoniae, and Pseudomonas aeruginosa, while others (glycopeptide: 4.03%, penam: 3.4%) were negligible in comparison (Fig. 8e). Tetracycline resistance was highest in rectal swabs similar to the oropharyngeal swab samples, with a moderate increase in its relative abundance observed in the antemortem samples (from PA rf: 0.22 to AM: 0.25) (Fig. 8f).
In RS A. baumannii has developed 15 new resistances to various antibiotics against cephalosporin, penam, phenicol, carbapenem, monobactam, aminoglycoside, penem, fluoroquinolone, diaminopyrimidine, lincosamide, rifampicin, glycylcycline, phosphonic acid, tetracycline, and macrolide. These resistances were mainly induced by medication with vancomycin, amikacin, and piperacillin-tazobactam (Fig. 8e).