Well, vitamin D is interesting because your body can’t fulfill its required amount through diet alone. A portion of it needs to be produced in the body, a process which requires sunlight.
SteelMarch on
Is it because of the beauty industry?
madkeepz on
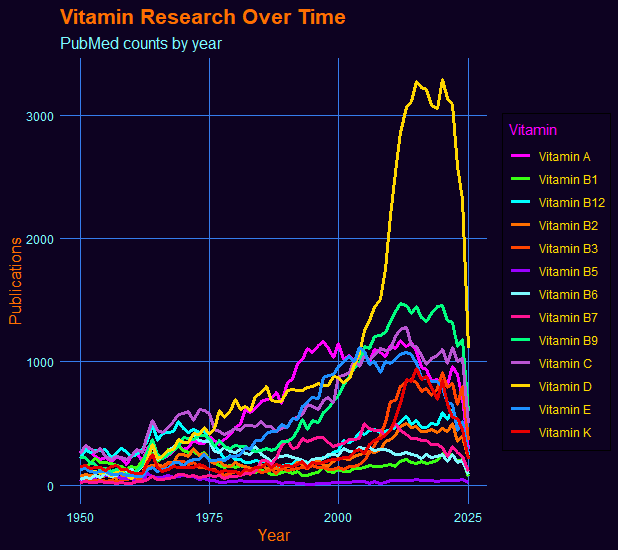
Was doomscrolling insta when i saw a post about vitamin D and i thought man at this point we probably just measure vitamin D in people because there’s so many papers about it we lost track of what it’s actually for. Which lead me to plot this just for funsies
brief methods:
Articles were taken from pubmed using the rentrez package. Search criteria was “Vitamin {x} [MESH] + date term”. All counts were then grouped by vitamin and plotted year by year. Inspired taken from an awesome video by [Riffomonas Project](https://www.youtube.com/watch?v=QX5aIzG8SQk)
edit: saw some comments about the steep decline in counts this year, which is due to the year not being closed. I had thought about cropping this to just 2024 but i was like… the amount of papers indexed to this date is somewhat informative so I thought it would be a better bang for your buck to leave it in, in case you were wondering how many papers were out until July 16, 2025
toastedzergling on
This chart might be mildly interesting, but this data sure isn’t presented beautifully
exkingzog on
I guess a chunk of this is due to the possible link with multiple sclerosis, which, IIRC, was proposed in the early 2000s
_Agrias_Oaks_ on
Apologies if this comes off as harsh, but this looks like rainbow spaghetti.
– Do you need to include all the vitamins you listed?
– What would the chart look like if you greyed out all but the most interesting lines?
– Do you need to go back to 1950? Research and publishing has changed significantly over the decades so comparing 2020 to 1950 doesn’t necessarily make sense.
– Is this color scheme color blind friendly?
Junosword on
probably because of Vitamin D, the Tall Homie on KEXP
Evan_802Vines on
B9 (Folate) is about to breakout, crossing 200DMA
DirectorLarge2461 on
I looked up possible reasons for the rise in Vitamin D interest in the early 2000s and got this:
“The surge in vitamin D research papers in the early 2000s was driven by a combination of factors, including increased awareness of widespread deficiency, discoveries of the vitamin’s broader health effects, improved measurement technologies, increased research funding, and media attention.”
What else might have happened in 2001-2003 that may have gotten vitamin D papers to skyrocket? :
Im more interested in why there’s a huge drop of vitamin research now, especially D
pynxem on
interesting that vit D is no.1 and yet we still don’t know what the correct daily recommendation is. From what I understand, most if not all of stated daily recs are based on one analysis, which has turned out to be incorrect. I’ve heard recommended should be 10x current number.
There’s also no direct link between vit D and psoriasis, even though it’s known to be good for minimizing it for most people.
ShaxAjax on
Really, all this commentary and nobody’s noticed that vitamin D’s graph line looks like a penis?
In any case, to be more constructive, for whatever reason this came out blurry, just pixellated to different degrees at every resolution it appears at. I don’t even begin to know how you’d fix that, but worth keeping in mind in future.
LoadsDroppin on
[Dysteleological Argument](https://en.m.wikipedia.org/wiki/Argument_from_poor_design) identifies the inability of human beings to synthesize some of these vitamins (in contrast to much of the animal kingdom) as one of the many factors that point to the absence of an “intelligent” design.
kkngs on
Vitamin D always shows amazing potential in observational studies and *always fails* in intervention studies with randomized controlled trials.
Its like that Peanuts skit with Lucy pulling the football every time Charlie Brown tries to kick it.

14 Comments
Well, vitamin D is interesting because your body can’t fulfill its required amount through diet alone. A portion of it needs to be produced in the body, a process which requires sunlight.
Is it because of the beauty industry?
Was doomscrolling insta when i saw a post about vitamin D and i thought man at this point we probably just measure vitamin D in people because there’s so many papers about it we lost track of what it’s actually for. Which lead me to plot this just for funsies
brief methods:
Articles were taken from pubmed using the rentrez package. Search criteria was “Vitamin {x} [MESH] + date term”. All counts were then grouped by vitamin and plotted year by year. Inspired taken from an awesome video by [Riffomonas Project](https://www.youtube.com/watch?v=QX5aIzG8SQk)
edit: saw some comments about the steep decline in counts this year, which is due to the year not being closed. I had thought about cropping this to just 2024 but i was like… the amount of papers indexed to this date is somewhat informative so I thought it would be a better bang for your buck to leave it in, in case you were wondering how many papers were out until July 16, 2025
This chart might be mildly interesting, but this data sure isn’t presented beautifully
I guess a chunk of this is due to the possible link with multiple sclerosis, which, IIRC, was proposed in the early 2000s
Apologies if this comes off as harsh, but this looks like rainbow spaghetti.
– Do you need to include all the vitamins you listed?
– What would the chart look like if you greyed out all but the most interesting lines?
– Do you need to go back to 1950? Research and publishing has changed significantly over the decades so comparing 2020 to 1950 doesn’t necessarily make sense.
– Is this color scheme color blind friendly?
probably because of Vitamin D, the Tall Homie on KEXP
B9 (Folate) is about to breakout, crossing 200DMA
I looked up possible reasons for the rise in Vitamin D interest in the early 2000s and got this:
“The surge in vitamin D research papers in the early 2000s was driven by a combination of factors, including increased awareness of widespread deficiency, discoveries of the vitamin’s broader health effects, improved measurement technologies, increased research funding, and media attention.”
What else might have happened in 2001-2003 that may have gotten vitamin D papers to skyrocket? :
[https://en.wikipedia.org/wiki/2002](https://en.wikipedia.org/wiki/2002)
Im more interested in why there’s a huge drop of vitamin research now, especially D
interesting that vit D is no.1 and yet we still don’t know what the correct daily recommendation is. From what I understand, most if not all of stated daily recs are based on one analysis, which has turned out to be incorrect. I’ve heard recommended should be 10x current number.
There’s also no direct link between vit D and psoriasis, even though it’s known to be good for minimizing it for most people.
Really, all this commentary and nobody’s noticed that vitamin D’s graph line looks like a penis?
In any case, to be more constructive, for whatever reason this came out blurry, just pixellated to different degrees at every resolution it appears at. I don’t even begin to know how you’d fix that, but worth keeping in mind in future.
[Dysteleological Argument](https://en.m.wikipedia.org/wiki/Argument_from_poor_design) identifies the inability of human beings to synthesize some of these vitamins (in contrast to much of the animal kingdom) as one of the many factors that point to the absence of an “intelligent” design.
Vitamin D always shows amazing potential in observational studies and *always fails* in intervention studies with randomized controlled trials.
Its like that Peanuts skit with Lucy pulling the football every time Charlie Brown tries to kick it.