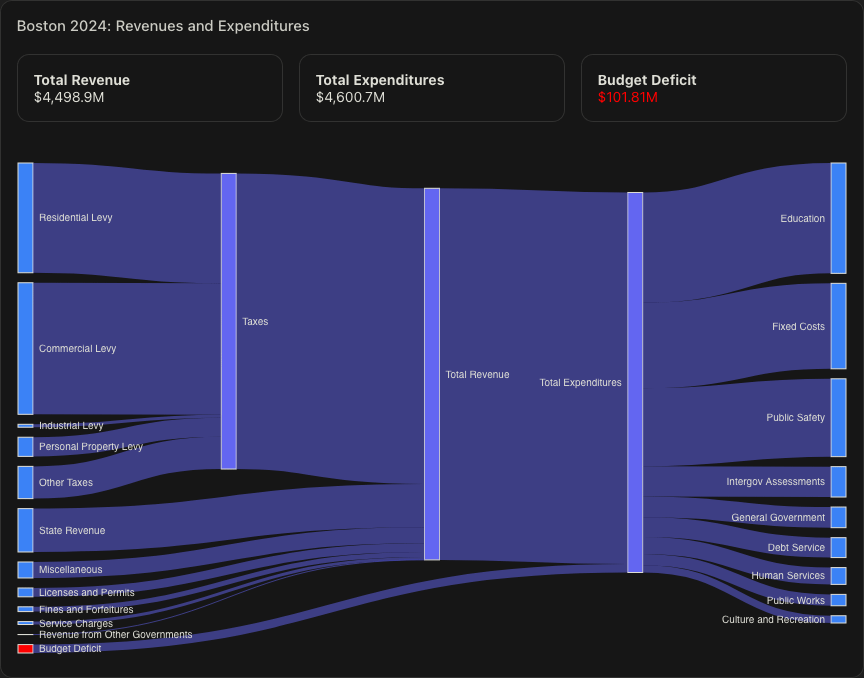
A Sankey diagram showing Boston’s municipal finances for 2024. The visualization tracks how money flows from revenue sources (left) to different expenditure categories (right).
This looks a bit awkward to me. The lack of numbers is what does it to me.
PG908 on
Assuming bonds were issued, one should break them out specifically, since they’re often associated with a specific improvement- such as X million dollars for a new facility or road or something.
JohninMichigan55 on
So is Boston going to cut spending, go out of business, or increase taxes?

4 Comments
A Sankey diagram showing Boston’s municipal finances for 2024. The visualization tracks how money flows from revenue sources (left) to different expenditure categories (right).
View the interactive version: [https://locovote.com/data/municipalities?name=Boston&year=2024](https://locovote.com/data/municipalities?name=Boston&year=2024)
Built with Observable Framework and D3:
– [https://observablehq.com/framework/](https://observablehq.com/framework/)
– [https://d3js.org/](https://d3js.org/)
Source code: [https://github.com/amarder/locovote](https://github.com/amarder/locovote)
Data sources:
– General Fund: [https://dls-gw.dor.state.ma.us/reports/rdPage.aspx?rdReport=ScheduleA.GeneralFund](https://dls-gw.dor.state.ma.us/reports/rdPage.aspx?rdReport=ScheduleA.GeneralFund)
– Tax Levies by Class: [https://dls-gw.dor.state.ma.us/reports/rdPage.aspx?rdReport=PropertyTaxInformation.TaxLevies.LeviesByClass&rdSubReport=True&rdResizeFrame=True](https://dls-gw.dor.state.ma.us/reports/rdPage.aspx?rdReport=PropertyTaxInformation.TaxLevies.LeviesByClass&rdSubReport=True&rdResizeFrame=True)
This looks a bit awkward to me. The lack of numbers is what does it to me.
Assuming bonds were issued, one should break them out specifically, since they’re often associated with a specific improvement- such as X million dollars for a new facility or road or something.
So is Boston going to cut spending, go out of business, or increase taxes?