
![[OC] Drag Force on Peloton compared to a lone cyclist](https://www.byteseu.com/wp-content/uploads/2025/07/ala3ezlulgef1-1227x1536.png "[OC] Drag Force on Peloton compared to a lone cyclist")
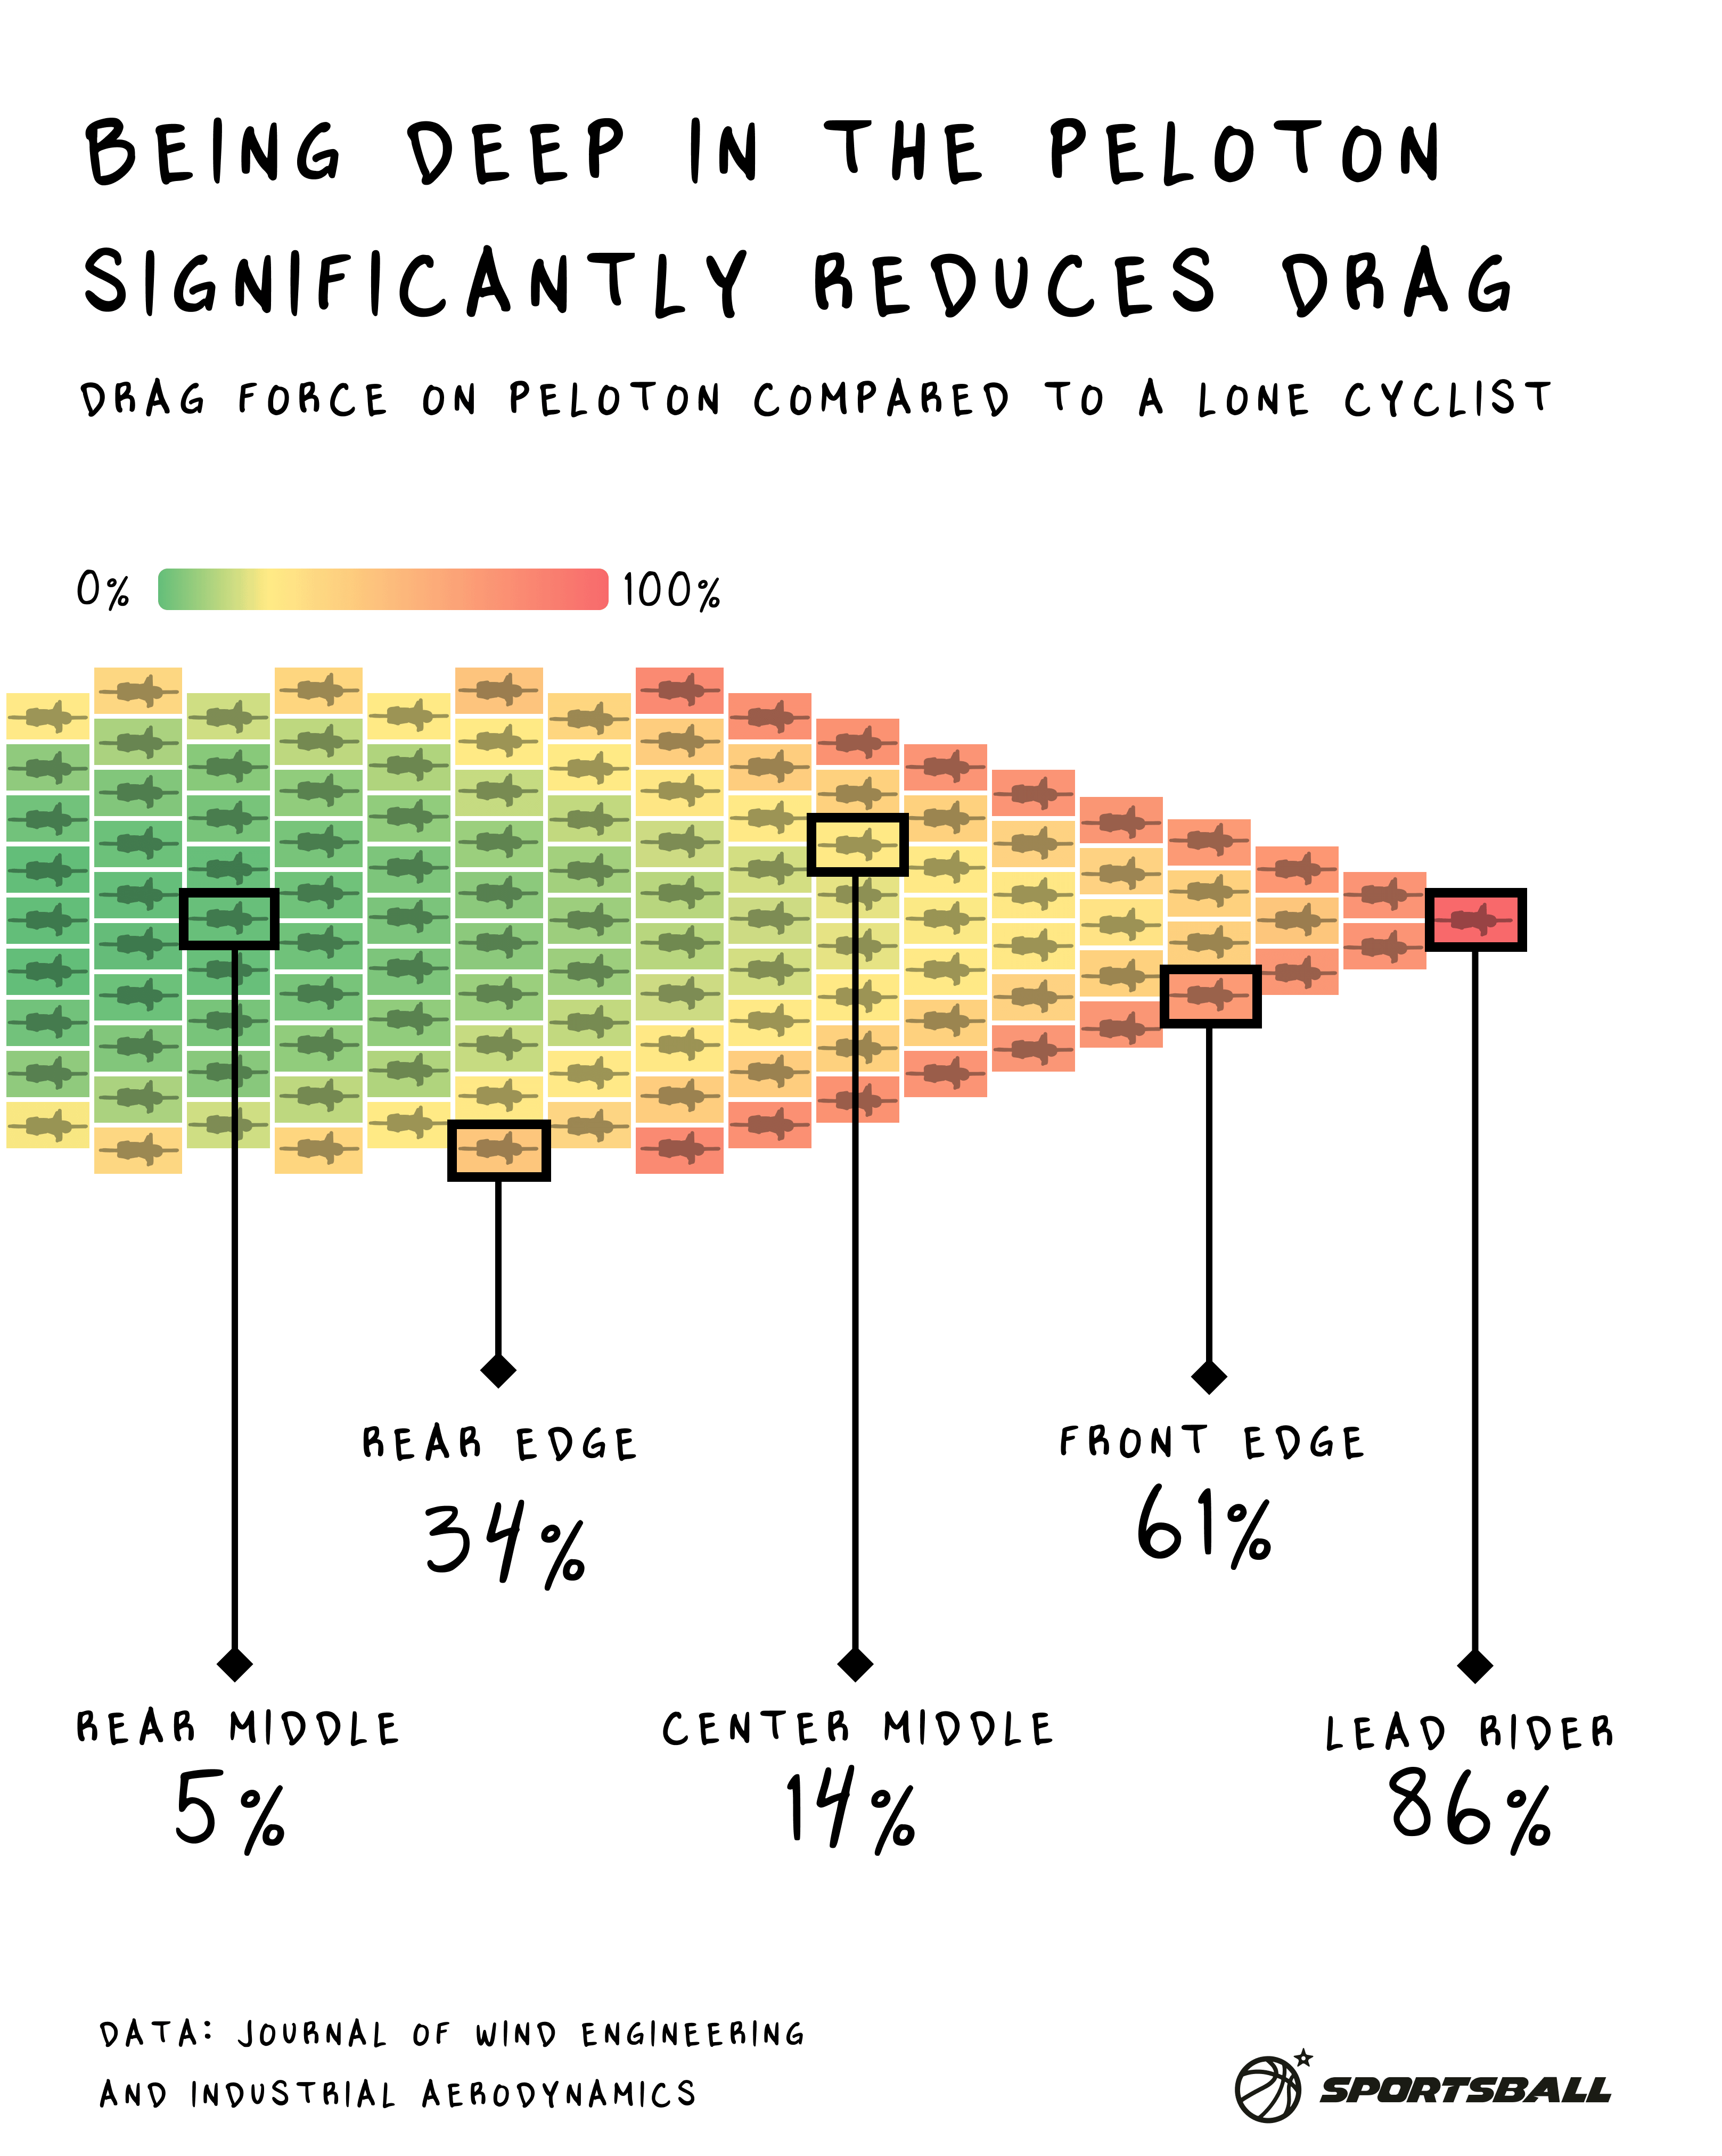
Air resistance felt by cyclists based on where they are in a group, relative to what would be felt by a cyclist riding alone.
Visualization made with excel and figma
Data from Journal of Wind Engineering and Industrial Aerodynamics here https://www.sciencedirect.com/science/article/pii/S0167610518303751#sec5
Original post on Instagram here https://www.instagram.com/p/DMaRr8iR6kl/?hl=en&img_index=1
Posted by Upstairs-East6154
25 Comments
Air resistance felt by cyclists based on where they are in a group, relative to what would be felt by a cyclist riding alone.
Visualization made with excel and figma
Data from Journal of Wind Engineering and Industrial Aerodynamics here [https://www.sciencedirect.com/science/article/pii/S0167610518303751#sec5](https://www.sciencedirect.com/science/article/pii/S0167610518303751#sec5)
Original post on Instagram here [https://www.instagram.com/p/DMaRr8iR6kl/?hl=en&img_index=1](https://www.instagram.com/p/DMaRr8iR6kl/?hl=en&img_index=1)
It’s kinda interesting that even the lead cyclist gets a boost from riding in formation rather than alone
Why would a cyclist choose to be the lead cyclist? I understand there are teams, but wouldn’t entire teams prefer not to be at the front? It seems to be a position with all downsides and no upsides
OH not the exercise bike. I was super confused for a second.
you need to show what the wind direction, wind speed, and peloton speed is.
The riders in back Yell “HONK” to encourage the rider in front.
Why would the lead rider experience a 14% decrease in drag compared to a lone cyclist?
The bicycle club I used to be in did something like this for tours. We’d form a line two abreast and rotate positions every few minutes.
As someone who cycles occasionally, this reminds me of 2 things:
– When these clusters crash, they crash bigly.
– When I’m out cycling, other random cyclists get way too close to me. Please stay away from me. I don’t want to be within 7 feet of you, bare minimum.
It took me a minute to realize they weren’t talking about stationary bikes.
Not pictured: The guy who got shelled out the back and is breathing through his asshole trying to get back onto the wheel
Shame the authors didn’t make more of an effort to validate the findings, for example by using peleton riders bike computer data (including their power output)
Even just in casual riding, the difference between being first and a few people back is extremely noticeable. Riding 20mph feels like you’re riding 18mph when you’re drafting
I was curious how this related to overall drag so I looked it up.
The two sources of drag are wind and rolling resistance. Obviously rolling resistance is not changed by drafting. At low speeds rolling resistance is the much larger number, and at high speeds wind resistance is. I looked up the average speed on flat ground during the tour de france, it’s ~26mph. I found a table of resistances and at 26mph the wind resistance accounts for 87.5% of the overall drag with no drafting.
With drafting, if you are in the rear middle only having 5% of the wind drag, the wind now accounts for 26% of your overall drag.
I would LOVE to see this data confirmed via actual tests. All pro riders and very many amateur racers use power meters, so it’s not something that would be overly difficult to collect. Just need 20+ riders and a flat straight road.
Also this simulation assumes all riders are the same size. The draft behind a larger rider is MUCH better.
My personal experience, just a gut feeling, is that this simulation would be overestimating the effect. But when you’re riding you ALSO have mechanical losses of the bike and rolling resistance. So perhaps this is accurate for pure wind drag.
Finally, it’s quite rare to have a peloton shaped like this phalanx shape. Usually it’s “across the road” with a flat front, or significantly strung out in a line, per perhaps 2-3 wide at most.
I’d like to see one of these but with lateral wind
why isn’t the lead rider 100%?
It would be interesting to see the power output for the different rider positions at a couple speeds, say 20, 25, and 30 MPH. Assuming all riders are equal weight etc… I wonder how important air friction is compared to rolling resistance.
Worth noting that aero drag is only one force that you are working against when cycling. Rear Middle isn’t spending 81% less energy than the Lead Rider. They are spending that much less against aero drag, but not that much less total.
There are various figures out there but you’re working about 25% less sat back in a pace line.
So there are very big energy expenditure savings, but not as much as this chart may imply at a glance.
That reminds me I still need to watch the new season of Tour Unchained.
I though those were elephants
Despite the greater aerodynamic gains of the center back, overall race contenders typicalky ride in the center middle. The relative aerodynamic gains to be had by riding in the center back are offset by the (much) higher risks of a crash that deep in the peleton.
Lovely visualisation. I’d love to see the same visualisation for total resistance – including the road and bike.
https://preview.redd.it/xi5sigbyzgef1.jpeg?width=1024&format=pjpg&auto=webp&s=ebb6eb82dee5925ce64dabf0916f6fecbdf58cf7
Fixed the font
Does this mean the lead rider actually gets a 14% reduction in drag as well? So everyone wins, just some much more than others