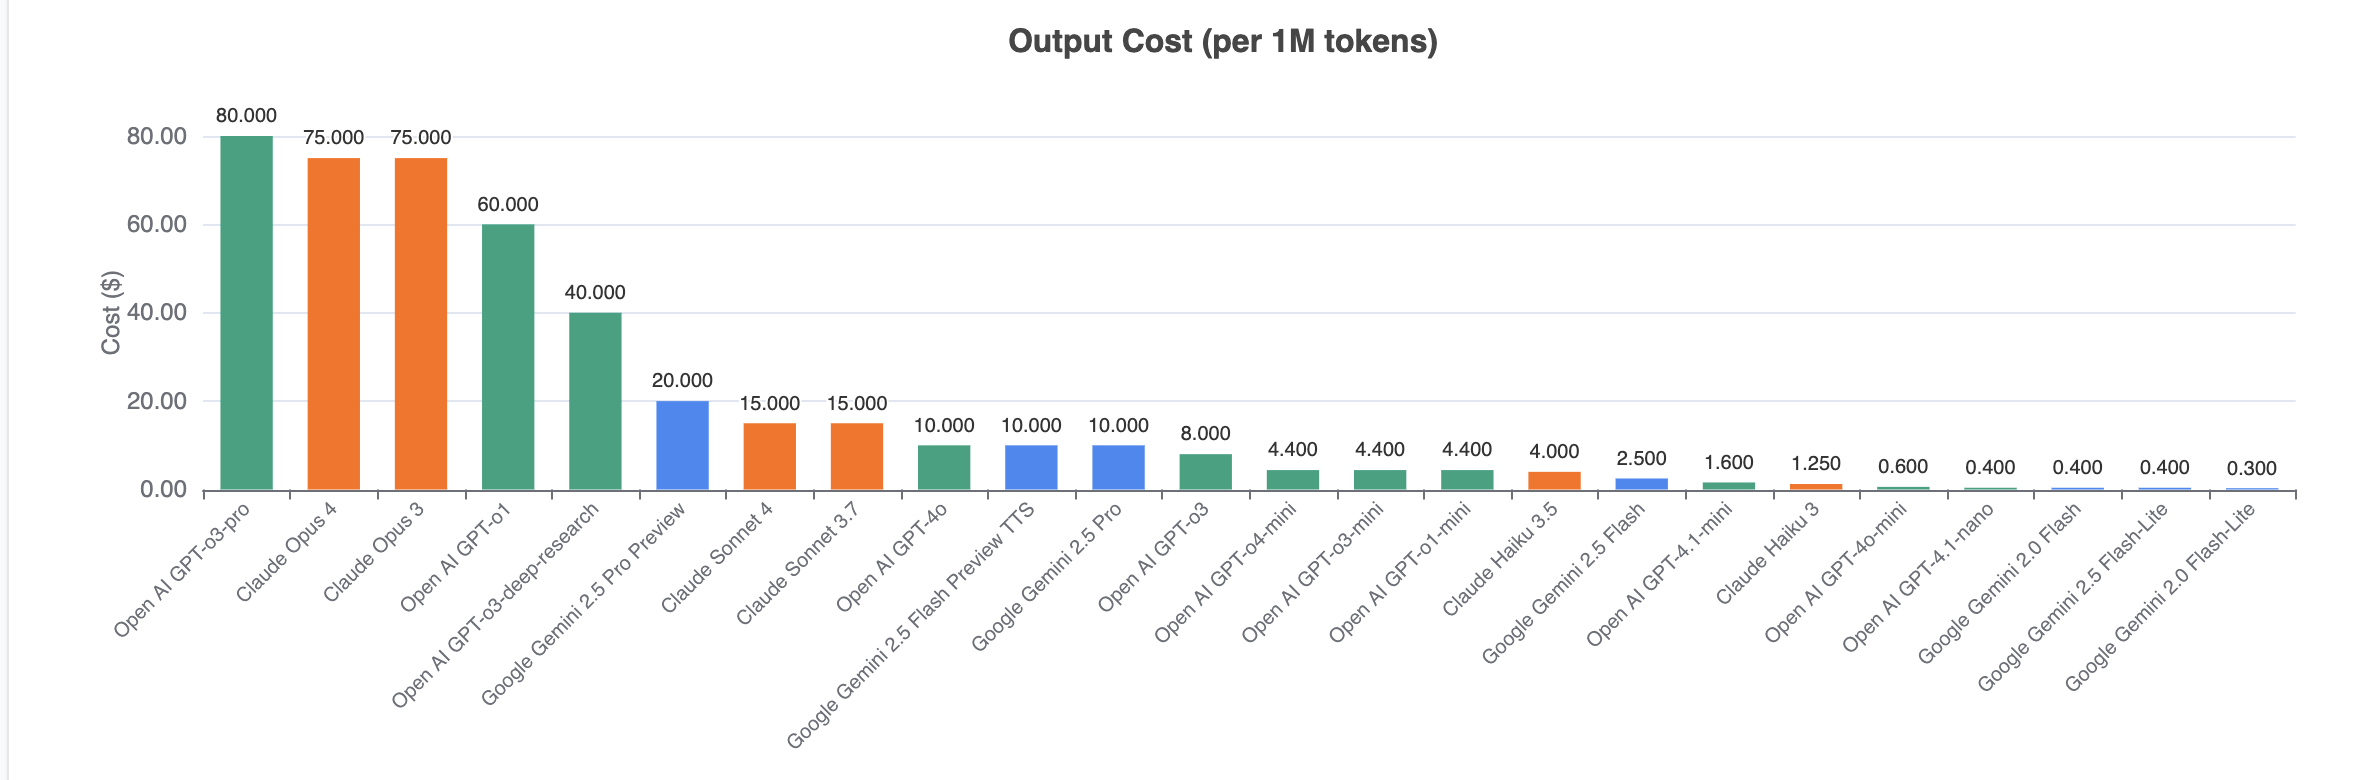
For those that don’t know, these models price “input” tokens differently from “output” tokens. The input is the prompt you send to the model, the output is the text you get back. Here I am just showing output cost. The correlation between input to output cost is very high but input tokens are cheaper, so to show the relative price of the APIs it is really only necessary to show one price. Feel free to visit the website to learn more.
hoovdc on
I like the concept, though Grok is noticeably missing.
Jubijub on
Isn’t there missing data ? This picture is not complete if you don’t know how many tokens are used to encode words / images, nor how many tokens are consumed with agents. I guess for models of a given family this is factored in the cost, but it may but be enough to bench models from different providers , or even generations of models
gturk1 on
It would be interesting to plot token cost against popular metrics for prose generation, problem solving or coding.

![[OC] Cost per 1M Response Tokens for Claude, Gemini and Open AI Model APIs](https://www.byteseu.com/wp-content/uploads/2025/07/wwucv6bo4wef1-1536x505.png "[OC] Cost per 1M Response Tokens for Claude, Gemini and Open AI Model APIs")
4 Comments
I made the chart here:
[https://pricepertoken.com/](https://pricepertoken.com/)
The data is sourced from:
[Google Gemini API Pricing](https://ai.google.dev/gemini-api/docs/pricing)
[OpenAI API Pricing](https://openai.com/api/pricing/)
[Anthropic API Pricing](https://www.anthropic.com/pricing#api)
For those that don’t know, these models price “input” tokens differently from “output” tokens. The input is the prompt you send to the model, the output is the text you get back. Here I am just showing output cost. The correlation between input to output cost is very high but input tokens are cheaper, so to show the relative price of the APIs it is really only necessary to show one price. Feel free to visit the website to learn more.
I like the concept, though Grok is noticeably missing.
Isn’t there missing data ? This picture is not complete if you don’t know how many tokens are used to encode words / images, nor how many tokens are consumed with agents. I guess for models of a given family this is factored in the cost, but it may but be enough to bench models from different providers , or even generations of models
It would be interesting to plot token cost against popular metrics for prose generation, problem solving or coding.