
![[OC] How Debt-to-GDP Has Changed in Major Economies Since 2008](https://www.byteseu.com/wp-content/uploads/2025/07/occsyesik6ff1-1024x644.jpeg "[OC] How Debt-to-GDP Has Changed in Major Economies Since 2008")
Made using excel
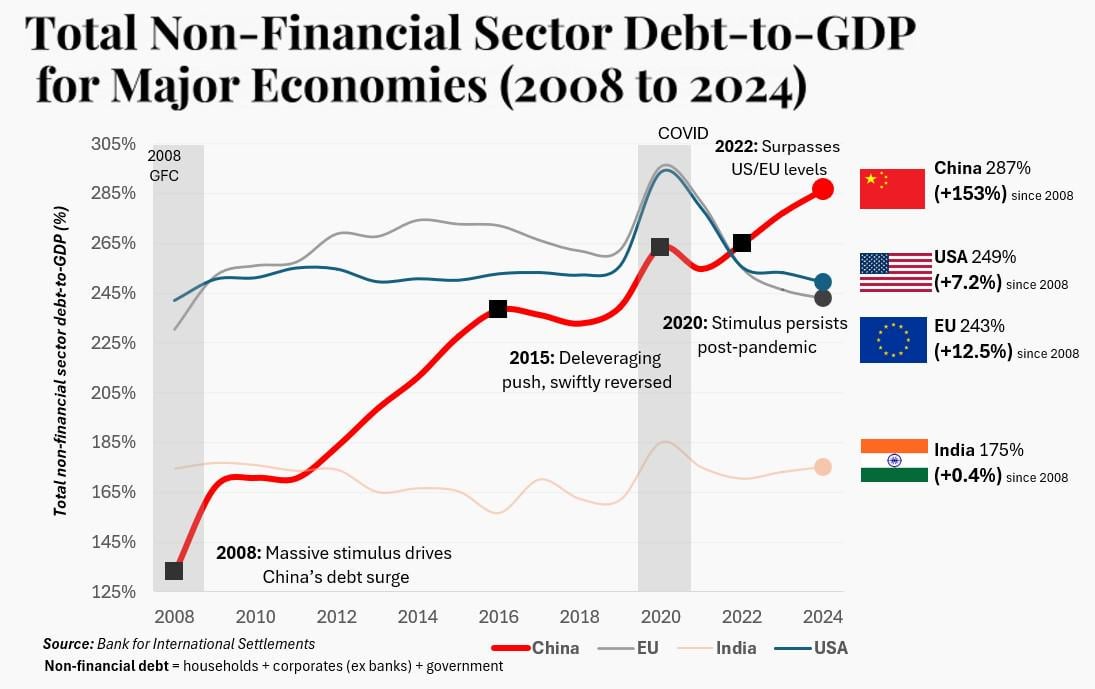
Data Source: https://data.bis.org/topics/TOTAL_CREDIT/data
I made this chart myself and wanted to share. I'm working on improving my data visualization skills.
This is total non-financial debt = households + nonbank corporates + government
Non-financial sector approach is the standard used by BIS, IMF, World Bank, and pretty much every central bank including Chinese authorities (PBOC) when measuring debt sustainability.
(Including banks would double count debt, since their liabilities are just the flip side of loans already counted elsewhere)
Posted by Mido_Aus
12 Comments
Made using Microsoft Excel. The flags are pasted in images and the annotations are text boxes.
Data Source: Bank for International Settlements
Link: [https://data.bis.org/topics/TOTAL_CREDIT/data](https://data.bis.org/topics/TOTAL_CREDIT/data)
So, does w/ Financial Sector Debt look worse? Aren’t they the ones who gifted us 2008?
Xi Jinping has actually spoken about it, which is very rare.
[China’s Xi Issues Rare Warning on Over-Investment in EVs, AI – FT](https://www.asiafinancial.com/chinas-xi-issues-rare-warning-on-over-investment-in-evs-ai-ft#:~:text=Xi%20told%20the%20conference%20that%20officials%20needed%20to,and%20leave%20problems%20to%20future%20generations%2C%E2%80%9D%20he%20said.)
*Xi told the conference that officials needed to focus not only on GDP growth but also “on how much debt is owed.”*
*“We should not let some people pass the buck and leave problems to future generations,” he said.*
He also directly called out officials who indulge in “reckless” investment projects that contribute to the debt problem.
Last time Xi spoke like this, it was about housing speculation growing out of control in 2017. He then popped the bubble and has refused to bail it out even to this day.
As much as I really dislike Xi, he isn’t as dumb as he looks, at least when compared to Trump and his new bill which I hate even more as an American.
Trump speaks so much that his words lose all meaning at the end of the day, but Xi rarely speaks at all, so when he does, it’s a sign that things are about to change.
China’s total debt to gdp is rising by 10% of gdp every year.
And the best part of it is that chinese fertility rate is 1.0 and is rapidly declining.
Heil emperor XI JINPING
China is going to collpase AGAIN, in 3, 2, 1, 1, 1, 1, 1, 0.5, 0.4, 0.2, 0.1, 0.05…
In an age when it’s so easy to go and be like “I used an AI tool to make this chart” you actually went back to excel.
I love this, good effort.
Unfortunately the US is about to rocket back up with trump’s terrible budget bill.
Begin the axes at 0 you heathens.
Would you know where the growth in debt is coming from? Also does this include regional government debt. What I know is regional governments in China is incurring more debt than national.
Also change your axis to start at zero. It may look squished that way but that’s the truthful representation of slopes.
But I was told that the US debt was out of control, and the only way to fix it was to cut services for poor people!
Yeah while those look bad for China, the true numbers are MUCH much worse.
IMF says only the deficit is 13.2% compared to the “official” Chinese one of 3%.
https://www.reddit.com/r/China/comments/1lmcnkp/imf_confirms_chinas_real_government_deficit_is/
There’s AT LEAST 11 trillion of off-the-books debt in local governments.
https://www.wsj.com/world/china/china-economy-debt-borrowing-33f08b5e?gaa_at=eafs&gaa_n=ASWzDAhPhKexwIbJkZqmurYPYDqg4eW5HRu3gVPqtKG-GIqeFGvd3AdF_5qXQqWeuQ4%3D&gaa_ts=6884d981&gaa_sig=OBruYlEiKyVybtwn-tYUkb4SdJrc8E5ID5GbiqzS_OlWrKRHaPtfV5tdNz9Xc7pfAqH-cVOoZgteWW8UUZ1EUw%3D%3D
Love this. Thanks for sharing.