Note: The official designation of a recession comes from a committee at the [National Bureau of Economic Research (NBER)](https://www.nber.org/news/business-cycle-dating-committee-announcement-january-7-2008), a private, nonprofit research organization. The committee considers a wide range of economy-wide, monthly data points, but the NBER views GDP as “the single best measure.” The committee calls a recession once there is a significant decline across these measures for more than a few months.
End the Fed peoples heads explode when you show them this graph
george8888 on
Huh, look at that. The US went off the Gold Standard in 1933. Amazing what having full control over your currency can do.
libertarianinus on
This explains the reason why the US dominates the world in wealth. Helped that the US was the only large country that had a manufacturing base that was not destroyed in WW2.
Igoresh on
Just to cover the bases, I turned this photo on edge to see if it was spelling something nefarious.
USAFacts on
Alternate title: There used to be more recessions.
Here’s a bit more on this chart:
The official designation of a recession comes from a committee at the National Bureau of Economic Research (NBER), a private, nonprofit research organization. The committee considers a wide range of economy-wide, monthly data points, but the NBER views GDP as “the single best measure.” The committee calls a recession once there is a significant decline across these measures for more than a few months.
The NBER’s official designation of a recession, then, doesn’t happen until there are several months of data, allowing it to be sure both that a recession happened and when exactly it started. In other words, the NBER looks backward, not at the present moment.
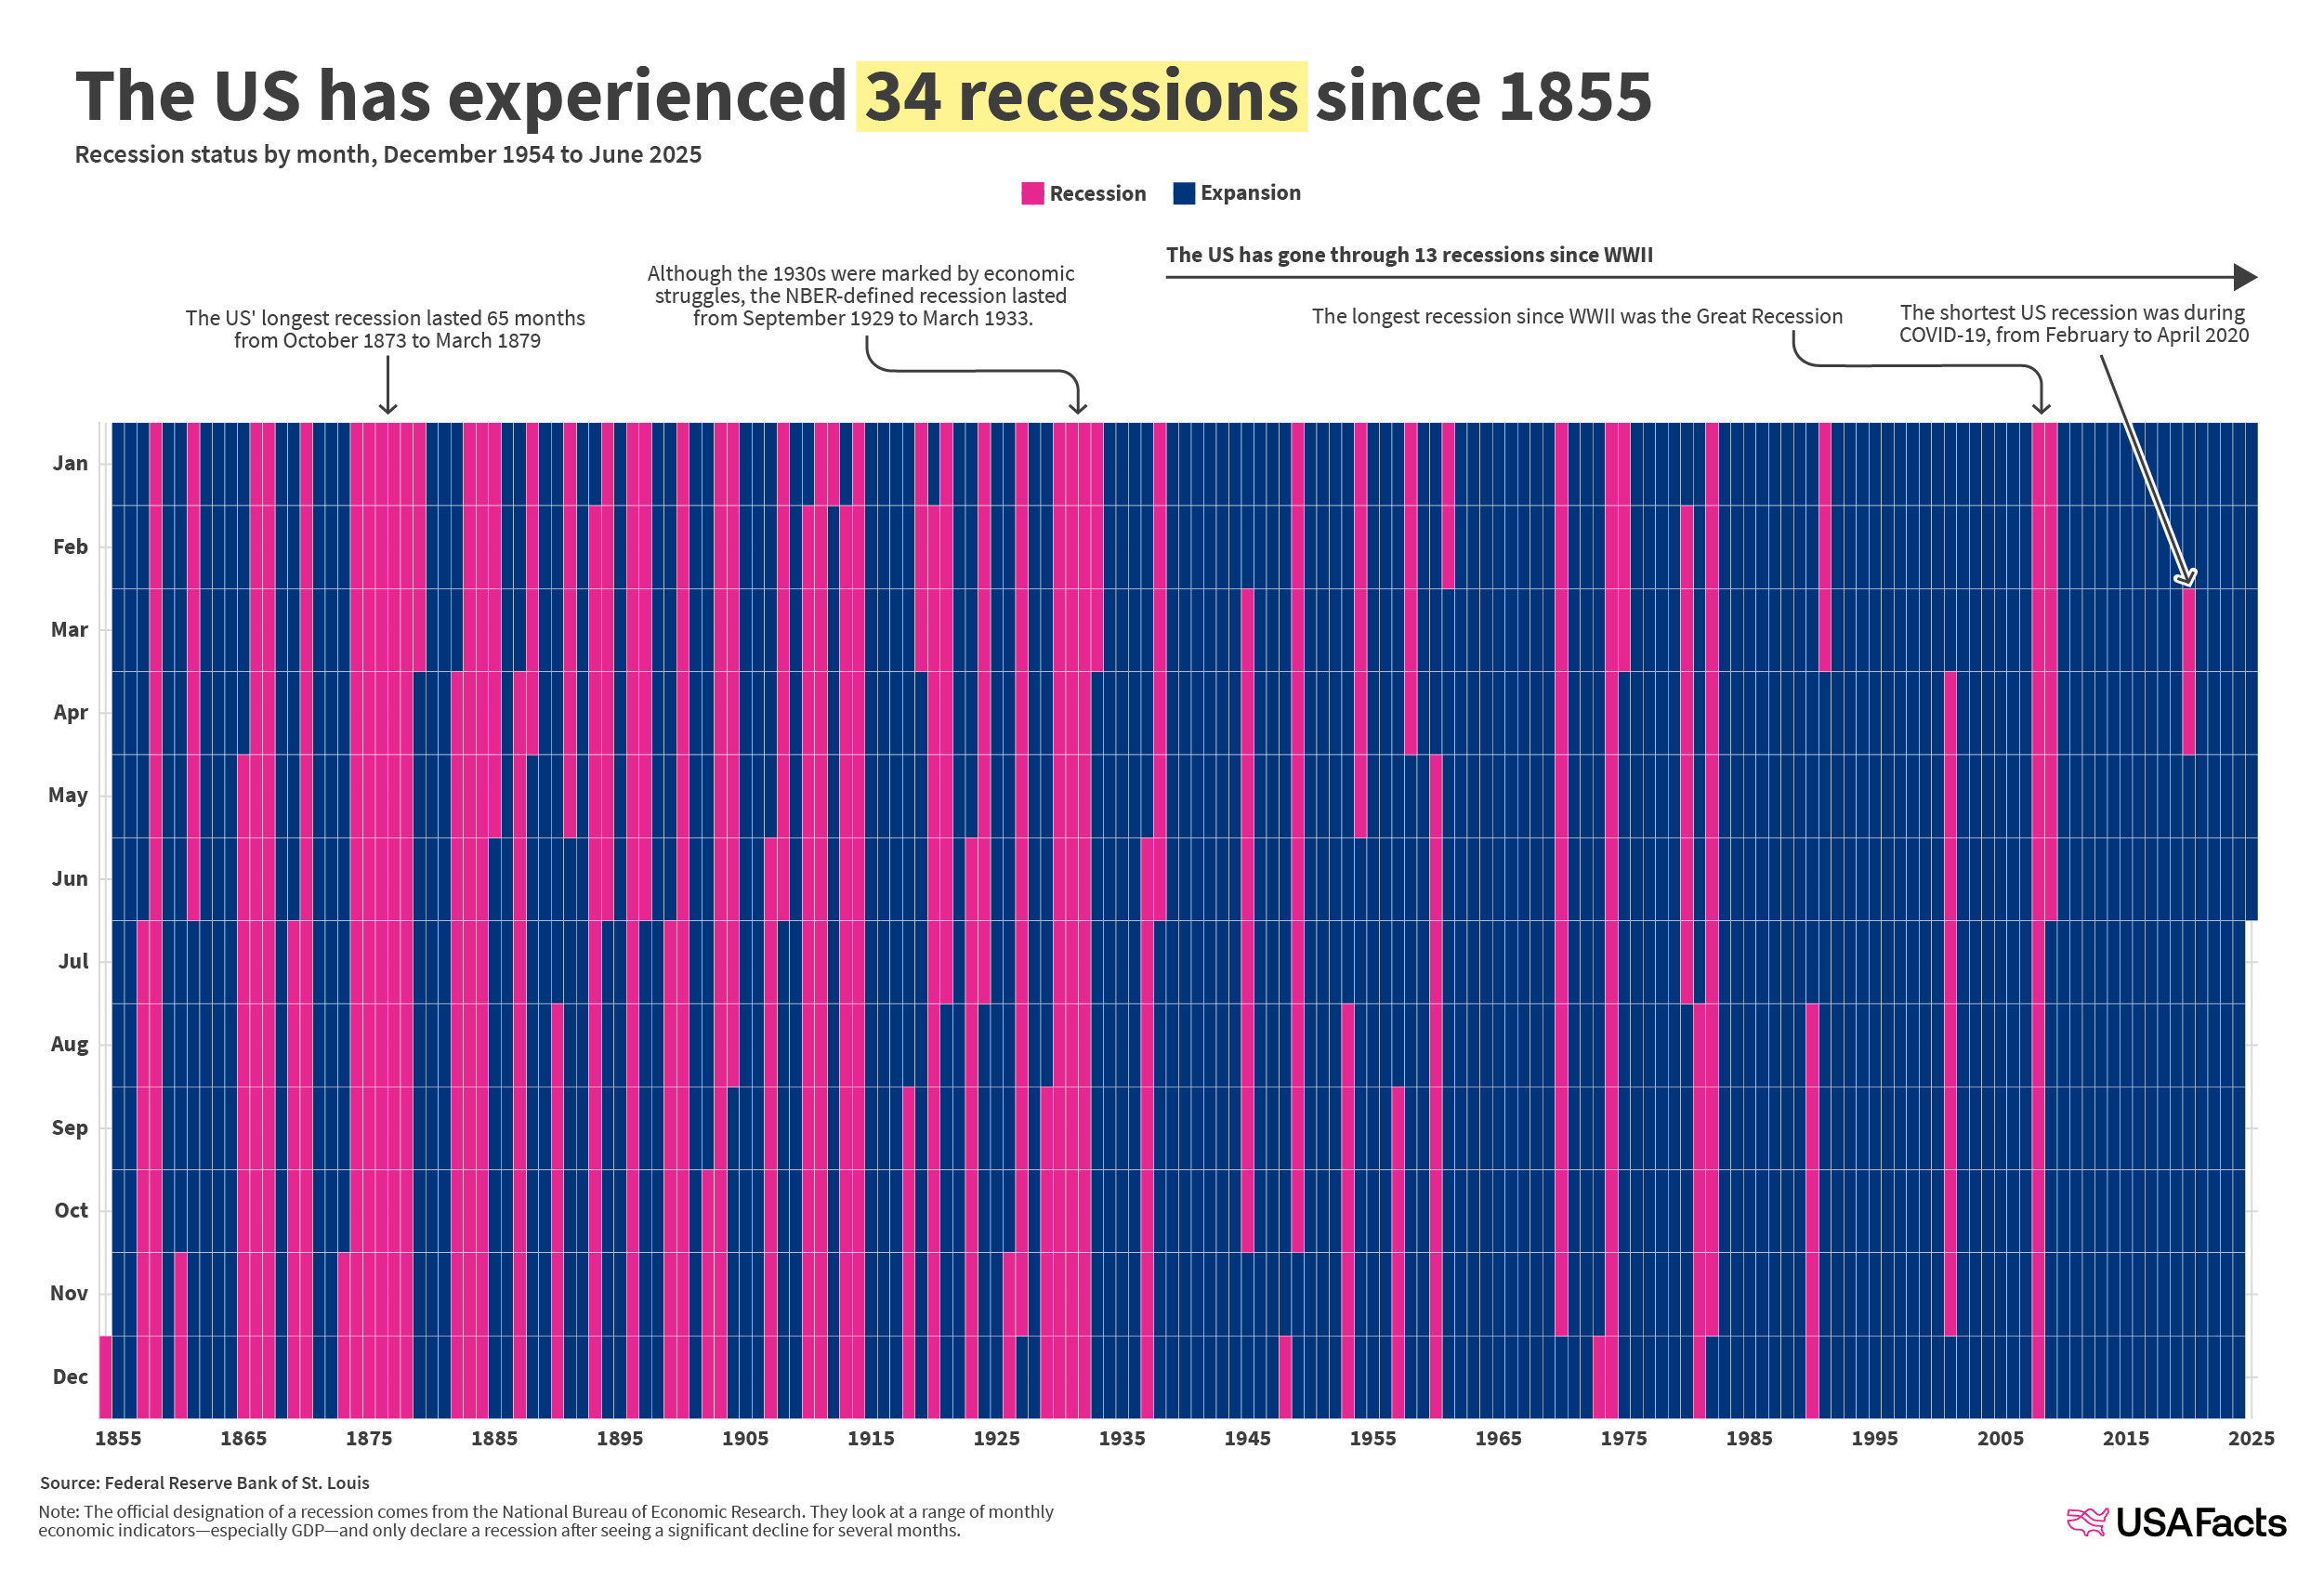
Using this measure, here’s a few insights:
* From 1855 to 2020, recessions lasted an average of 17 months. In the 20th and 21st centuries, the average recession has decreased to 14 months.
* The US’ longest recession lasted 65 months from October 1873 to March 1879
* The US has gone through 13 recessions since WWII
* The longest recession since WWII was the Great Recession
* The shortest US recession was during COVID-19, from February to April 2020
* Although economic struggles and the Great Depression marked the 1930s, the NBER-defined recession lasted from September 1929 to March 1933.
thisisnahamed on
Don’t show this to the Libertarians. Their hearts and brains will explode.
Hot-Category2986 on
4 recessions in the life of a millennial.
7 in my parents life time.
This chart makes it appear that the time between recessions is going down.
But also suggests the frequency is high enough that we should not treat recessions as once in a life time events.
Perhaps some context on the definition of a recession and the relative size (other than duration) is necessary.
Katwill666 on
From the creation of the Fed in 1913 to 2025 (112 years) there were 9 recessions that lasted over a year. 112 years prior to the creation of the Fed (1800-1912) there were 24 recessions that lasted over a year.
DrawPitiful6103 on
This chart is not at all accurate. Let’s begin with the “longest recession” from ’73 to ’79.
>
Yet what sort of
>“depression” is it which saw an extraordinarily large expansion
>of industry, of railroads, of physical output, of net national
>product, or real per capita income? As Friedman and Schwartz
>admit, the decade from 1869 to 1879 saw a 3-percent-per annum
>increase in money national product, an outstanding
>real national product growth of 6.8 percent per year in this
>period, and a phenomenal rise of 4.5 percent per year in real
>product per capita. Even the alleged “monetary contraction”
>never took place, the money supply increasing by 2.7 percent
>per year in this period. From 1873 through 1878, before
>another spurt of monetary expansion, the total supply of bank
>money rose from $1.964 billion to $2.221 billion—a rise of 13.1
>percent or 2.6 percent per year. In short, a modest but definite
>rise, and scarcely a contraction.
Rothbard’s History of Money and Banking in the United States, pg 154.
In fact, recessions prior to the Great Depression, were almost invariably mild and over with rapidly.
yourskullmytoilet on
endless money printing has done the US wonders. look how happy everyone over at reddit is !!
UniversityFrosty2426 on
FDR really smoothed out our economic cycles that Americans that we are trying our best to destroy it to return the insane cycles of boom/bust
MrNiceguy037 on
Instead of binary values for the tiles you could also use a color gradient in reddish and blueish for recession and growth to make the extend of the recessions and expansions visible..
DrawPitiful6103 on
According to this chart, there were only three years between the end of the civil war 1865 and 1880 where the economy was growing. So during 12 out of those 15 years, the economy of the USA was supposedly contracting.
And yet the American “economy took off after the [Civil War.](https://world101.cfr.org/cfr_glossary/455) Between 1865 and 1898, coal production rose by 800 percent and railway track mileage by 567 percent. By the middle of the 1880s, the United States had surpassed Britain as the world’s leading producer of manufactured goods and steel.”
Not sure how you can reconcile that with the perpertual depression depicted in this chart.
tomtomtomo on
congratulations! actually beautiful data!!
You’d think after such a great recession free period that everyone would be flourishing. Shows how captured the economy is that it feels so different than what it should.
volkovolkov on
Getting off the gold standard definitely was the main factor in decreasing the length and frequency of recessions, however I don’t see anyone mentioning the increase in transfer payments (essentially, the social safety net) after the Great Depression.
With cuts to medicare/medicaid, food stamps, and welfare in general, you can expect recessions to happen more often and for longer.
gimmickypuppet on
Actually beautiful, actually informative. Good job!
CinaminLips on
Wow, someone really needs to defrag their computer
/j
warmbowski on
I wonder if it would be meaningful to overlay a graph of some inflationary data
Mindless_Giraffe6887 on
Perhaps not coincidentally, Keynes’ *General Theory of Employment* was published in 1936
reichjef on
Since the adoption of Keynesian economic theory, recessions have been less severe and more infrequent.
Kal-Elm on
The ~~Great~~ historically speaking, somewhat average Recession
/s idk anything about its comparative depth
Overall_Falcon_8526 on
Hard not to interpret this as the success of Keynsian economics and Federal Reserve policy – which certain political parties are furiously trying to dismantle.
Dokan86 on
Clearly we need to go back to no central banking and less financial regulation. Maybe even a hard money standard!
atg115reddit on
Yeah this makes me realize that GDP is not a good indicator of quality of life
Noolbenger314 on
Interesting the gold standard ended in 1933 and that’s when the frequency of recessions dropped dramatically.
I wonder if the expansion and recession periods post 1933 have different behaviors than pre 1933. For example faster and longer growth but sharp, aggressive recessions stopped through economic policy to continue (artificially) the growth cycles.
alexbananas on
There were 2 quarters with GDP decline in 2022 Which is the literal definition of a recession
crusoe on
Don’t show this image to goldbugs.
Czechs_Mix_ on
Not me tilting the screen to read the message
Synreal on
Next recession will be after Trump is out of pffice if a democrat gets elected. So we may be safe for another 10 years or so.
MichiganKarter on
This is why people had photos of FDR on their walls.

![This history of American recessions [OC]](https://www.byteseu.com/wp-content/uploads/2025/07/8j6sqzajc8gf1-1536x1045.png "This history of American recessions [OC]")
31 Comments
Source: [Federal Reserve Bank of St. Louis (FRED)](https://fred.stlouisfed.org/series/USREC)
Tools: Datawrapper, Illustrator
Note: The official designation of a recession comes from a committee at the [National Bureau of Economic Research (NBER)](https://www.nber.org/news/business-cycle-dating-committee-announcement-january-7-2008), a private, nonprofit research organization. The committee considers a wide range of economy-wide, monthly data points, but the NBER views GDP as “the single best measure.” The committee calls a recession once there is a significant decline across these measures for more than a few months.
More data [here](https://usafacts.org/articles/what-is-a-recession-what-have-recessions-looked-like-in-the-past/)
End the Fed peoples heads explode when you show them this graph
Huh, look at that. The US went off the Gold Standard in 1933. Amazing what having full control over your currency can do.
This explains the reason why the US dominates the world in wealth. Helped that the US was the only large country that had a manufacturing base that was not destroyed in WW2.
Just to cover the bases, I turned this photo on edge to see if it was spelling something nefarious.
Alternate title: There used to be more recessions.
Here’s a bit more on this chart:
The official designation of a recession comes from a committee at the National Bureau of Economic Research (NBER), a private, nonprofit research organization. The committee considers a wide range of economy-wide, monthly data points, but the NBER views GDP as “the single best measure.” The committee calls a recession once there is a significant decline across these measures for more than a few months.
The NBER’s official designation of a recession, then, doesn’t happen until there are several months of data, allowing it to be sure both that a recession happened and when exactly it started. In other words, the NBER looks backward, not at the present moment.
Using this measure, here’s a few insights:
* From 1855 to 2020, recessions lasted an average of 17 months. In the 20th and 21st centuries, the average recession has decreased to 14 months.
* The US’ longest recession lasted 65 months from October 1873 to March 1879
* The US has gone through 13 recessions since WWII
* The longest recession since WWII was the Great Recession
* The shortest US recession was during COVID-19, from February to April 2020
* Although economic struggles and the Great Depression marked the 1930s, the NBER-defined recession lasted from September 1929 to March 1933.
Don’t show this to the Libertarians. Their hearts and brains will explode.
4 recessions in the life of a millennial.
7 in my parents life time.
This chart makes it appear that the time between recessions is going down.
But also suggests the frequency is high enough that we should not treat recessions as once in a life time events.
Perhaps some context on the definition of a recession and the relative size (other than duration) is necessary.
From the creation of the Fed in 1913 to 2025 (112 years) there were 9 recessions that lasted over a year. 112 years prior to the creation of the Fed (1800-1912) there were 24 recessions that lasted over a year.
This chart is not at all accurate. Let’s begin with the “longest recession” from ’73 to ’79.
>
Yet what sort of
>“depression” is it which saw an extraordinarily large expansion
>of industry, of railroads, of physical output, of net national
>product, or real per capita income? As Friedman and Schwartz
>admit, the decade from 1869 to 1879 saw a 3-percent-per annum
>increase in money national product, an outstanding
>real national product growth of 6.8 percent per year in this
>period, and a phenomenal rise of 4.5 percent per year in real
>product per capita. Even the alleged “monetary contraction”
>never took place, the money supply increasing by 2.7 percent
>per year in this period. From 1873 through 1878, before
>another spurt of monetary expansion, the total supply of bank
>money rose from $1.964 billion to $2.221 billion—a rise of 13.1
>percent or 2.6 percent per year. In short, a modest but definite
>rise, and scarcely a contraction.
Rothbard’s History of Money and Banking in the United States, pg 154.
In fact, recessions prior to the Great Depression, were almost invariably mild and over with rapidly.
endless money printing has done the US wonders. look how happy everyone over at reddit is !!
FDR really smoothed out our economic cycles that Americans that we are trying our best to destroy it to return the insane cycles of boom/bust
Instead of binary values for the tiles you could also use a color gradient in reddish and blueish for recession and growth to make the extend of the recessions and expansions visible..
According to this chart, there were only three years between the end of the civil war 1865 and 1880 where the economy was growing. So during 12 out of those 15 years, the economy of the USA was supposedly contracting.
And yet the American “economy took off after the [Civil War.](https://world101.cfr.org/cfr_glossary/455) Between 1865 and 1898, coal production rose by 800 percent and railway track mileage by 567 percent. By the middle of the 1880s, the United States had surpassed Britain as the world’s leading producer of manufactured goods and steel.”
https://education.cfr.org/learn/reading/how-did-united-states-become-global-power#:~:text=Its%20economy%20took%20off%20after,of%20manufactured%20goods%20and%20steel.
Not sure how you can reconcile that with the perpertual depression depicted in this chart.
congratulations! actually beautiful data!!
You’d think after such a great recession free period that everyone would be flourishing. Shows how captured the economy is that it feels so different than what it should.
Getting off the gold standard definitely was the main factor in decreasing the length and frequency of recessions, however I don’t see anyone mentioning the increase in transfer payments (essentially, the social safety net) after the Great Depression.
With cuts to medicare/medicaid, food stamps, and welfare in general, you can expect recessions to happen more often and for longer.
Actually beautiful, actually informative. Good job!
Wow, someone really needs to defrag their computer
/j
I wonder if it would be meaningful to overlay a graph of some inflationary data
Perhaps not coincidentally, Keynes’ *General Theory of Employment* was published in 1936
Since the adoption of Keynesian economic theory, recessions have been less severe and more infrequent.
The ~~Great~~ historically speaking, somewhat average Recession
/s idk anything about its comparative depth
Hard not to interpret this as the success of Keynsian economics and Federal Reserve policy – which certain political parties are furiously trying to dismantle.
Clearly we need to go back to no central banking and less financial regulation. Maybe even a hard money standard!
Yeah this makes me realize that GDP is not a good indicator of quality of life
Interesting the gold standard ended in 1933 and that’s when the frequency of recessions dropped dramatically.
I wonder if the expansion and recession periods post 1933 have different behaviors than pre 1933. For example faster and longer growth but sharp, aggressive recessions stopped through economic policy to continue (artificially) the growth cycles.
There were 2 quarters with GDP decline in 2022 Which is the literal definition of a recession
Don’t show this image to goldbugs.
Not me tilting the screen to read the message
Next recession will be after Trump is out of pffice if a democrat gets elected. So we may be safe for another 10 years or so.
This is why people had photos of FDR on their walls.