

A total of 297 students were included in the final analysis of this study after excluding 62 students (17.2%) who were not in their final year of the academic program. 23% (n = 68) of the students were from the Applied Medical Sciences, whereas 10.4% (n = 31) were from the College of Dentistry. The proportion of female students included in this study was 53.9% (n = 160). Over half of the study sample aged between 21 and 22 years (52.9%, n = 157), with the majority of them being single (98.0%, n = 291). 97% of students (n = 288) were unemployed, with 26.9% of students (n = 80) reporting a family income of > SR 20,000 per month. Most of the students (92.9%, n = 276) reported living with their family. Over one-third of the students (37.7%, n = 112) thought about dropping out of the program, while 53.9% of students (n = 160) reported a cumulative GPA between 4.50 and 5.00 (grade A). 54% of students (n = 159) were within the healthy weight range (BMI 18.5–24.9 kg/m2); 81.8% of students (n = 243) never smoked. Over half of the students (54.2%, n = 161) reported sleeping < 7 h per day on average, whereas 90.2% of students (n = 268) reported media use for non-educational proposes for > 2 hours per day (Table 1).
School engagement and student burnout
Distribution of the responses of the students for the USEI and MBI-SS is provided as Supplementary Materials. (Table S1, Table S2) Students who responded to items 3,4,6, and 26 by “Always” were 149 (50.2%), 131 (44.1%), 129 (43.4%), and 85 (28.6%), respectively. Students who responded to item 1 by “Almost always” were 78 (26.3%). Students who responded to item 22 by “Often” were 63 (21.2%). Students who responded to items 5,14,15,16, 17,19,25,28, and 32 by “Sometimes” were 78 (26.3%), 81 (27.3%), 105 (35.4%), 92 (31.0%), 78 (26.3%), 89 (30.0%), 65 (21.9%), and 75 (25.3%), respectively. None of the students responded to any of the items included in the USEI by “Regularly”, “Almost never”, or “Never”.
Students who responded to items 1, 2, 3, 5, 12, 13, and 15 were 63 (21.2%), 73 (24.6%), 79 (26.6%), 70 (23.6%), 75 (25.3%), 87 (29.3%), and 61 (20.5%). Students who responded to item 14 by “Every week” were 67 (22.6%). Students who responded to items 4, 10, and 15 by “A few times a month” were 67 (22.6%), 70 (23.6%), and 61 (20.5%), respectively. Students who responded to items 6, 7, 8, 9, and 11 by “Monthly” were 60 (20.2%), 69 (23.2%), 56 (18.9%), 62 (20.9%), and 69 (23.2%), respectively. Mean school engagement was 51.7 ± 15.4 (score out of 90, minimum 7 and maximum 90)) which shows a limited level of school engagement (57.5%), while mean student burnout was 109 ± 30.5 (score out of 195, minimum 30 and maximum 195) which indicates a high level of student burnout (55.9%). Descriptive data on school engagement and student burnout are provided in Table 2; Fig. 1.
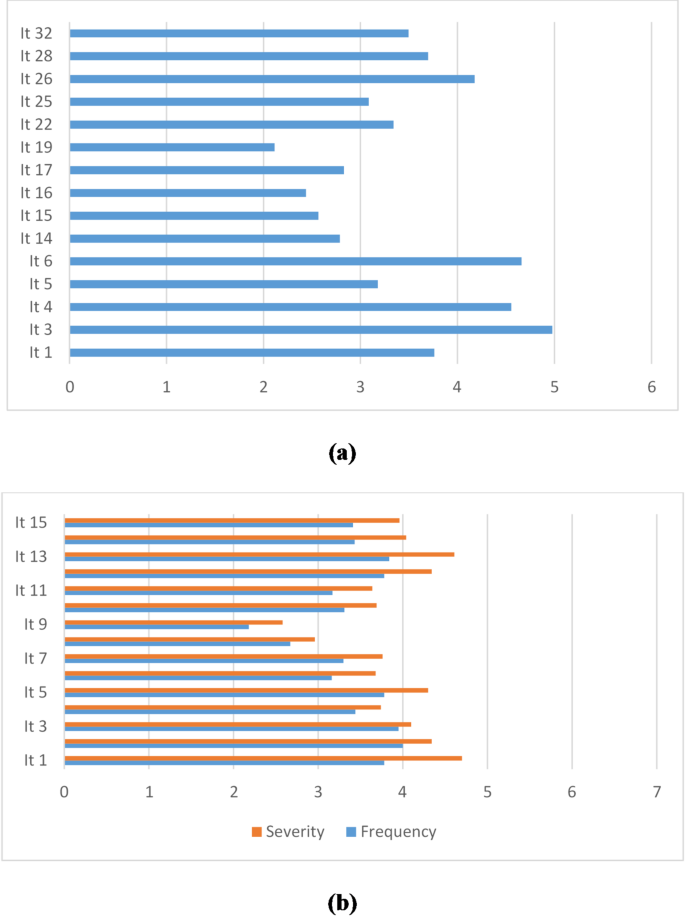
Frequency of school engagement (a); frequency and severity of student burnout (b).
Although a statistically significant relationship was found between school engagement and student burnout (r = 0.27, p < 0.001), the strength of this correlation is considered negligible. (Fig. 2).
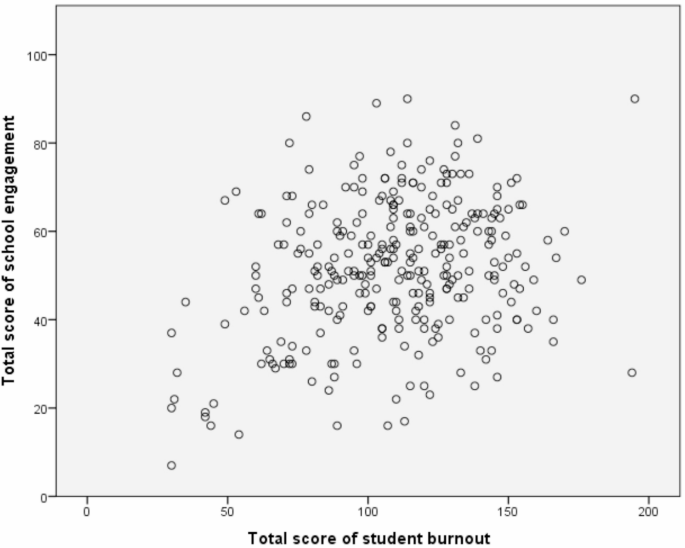
Correlation between school engagement and student burnout.
Factors associated with school engagement and student burnout
Table 3 illustrates the associations between characteristics of students, school engagement, and student burnout. The mean score of school engagement was significantly higher among students who did not think about dropping out of the program compared to students who thought about dropping out of the program (53.5 ± 14.7 vs. 48.6 ± 16.1, respectively, p = 0.008). The mean score of school engagement was significantly different across the different cumulative GPA groups (p = 0.006). Post-hoc test indicated no significant difference across the GPA groups after correcting for multiple tests.
The mean score of student burnout was significantly different across the different colleges (p < 0.001). Post-hoc test indicated that students enrolled in the Nursing program reported significantly lower mean scores of burnout compared to students enrolled in Pharmacy and Dentistry (p < 0.001 and p = 0.002, respectively). Additionally, data obtained using an independent t-test confirm that students enrolled in a program that is more than 4 years in length have significantly higher scores of burnout compared to students enrolled in a 4-year program (118 ± 29.8 vs. 103 ± 29.7, respectively, p < 0.001). Female students reported significantly higher scores of student burnout compared to male students (113 ± 29.2 vs. 105 ± 31.6, respectively, p = 0.016). The mean score of student burnout was significantly higher among students who thought about dropping out of the program compared to students who did not think about dropping out of the program (114 ± 35.0 vs. 106 ± 27.1, respectively, p = 0.021). The mean score of student burnout was significantly different across the different cumulative GPA groups (p < 0.001). Post-hoc tests indicated that students with cumulative GPAs of “A” and “B” reported significantly lower mean scores of burnout compared to students with cumulative GPAs of “D” (p = 0.001 and p = 0.007, respectively). The mean score of student burnout was significantly higher among students who sleep < 7 h per day on average compared to students who sleep for ≥ 7 h per day (113 ± 29.8 vs. 105 ± 31.0, respectively, p = 0.019).
Simple linear regression analysis indicated that school engagement was predicted by student living status (beta (B)= -6.57, Standard error (SE) = 3.13 [95% Confidence Interval (CI): -12.7 to -0.42], p = 0.036),The results suggest that students living alone or with family showed higher levels of engagement compared to those living in other arrangements. Thought about dropping out of the program also predicted school engagement significantly (B= -4.90, SE = 1.83 [95% CI: -8.49 to 1.30], p = 0.008), with students considering dropping out showing lower engagement levels. Additionally, cumulative GPA (B = 4.27, SE = 1.27 [95% CI: 1.76 to 6.78], p = 0.001), indicating that higher GPA scores are associated with increased levels of engagement.
Student burnout was predicted by college (B = 2.63, SE = 1.04 [95% CI: 0.58 to 4.67], p = 0.012), indicating differences in burnout levels across colleges. Program duration also significantly predicted student burnout (B = 14.8, SE = 3.51 [95% CI: 7.92 to 21.7], p < 0.001), with longer program durations associated with higher levels of burnout. Sex significantly predicted student burnout (B = 8.52, SE = 3.53 [95% CI: 1.58 to 15.5], p = 0.016), with female students experiencing higher levels of burnout compared to male students. Thought about dropping out of the program significantly predicted student burnout (B = 8.42, SE = 3.63 [95% CI: 1.28 to 15.6], p = 0.021), with students who considered dropping out experiencing higher levels of burnout. Cumulative GPA significantly predicted student burnout (B= -9.44, SE = 2.52 [95% CI: -14.4 to -4.49], p < 0.001), with higher GPA associated with lower levels of burnout. Average sleeping hours per day significantly predicted student burnout (B= -8.31, SE = 3.53 [95% CI: -15.3 to -1.36], p = 0.019), with students who sleep ≥ 7 h experiencing lower levels of burnout compared to those who sleep < 7 h per day. (see Table 4).