
![[OC] The IQ Bell Curve meme is wrong and I can prove it](https://www.byteseu.com/wp-content/uploads/2025/08/omwx4aiyv0hf1-1536x1156.png "[OC] The IQ Bell Curve meme is wrong and I can prove it")
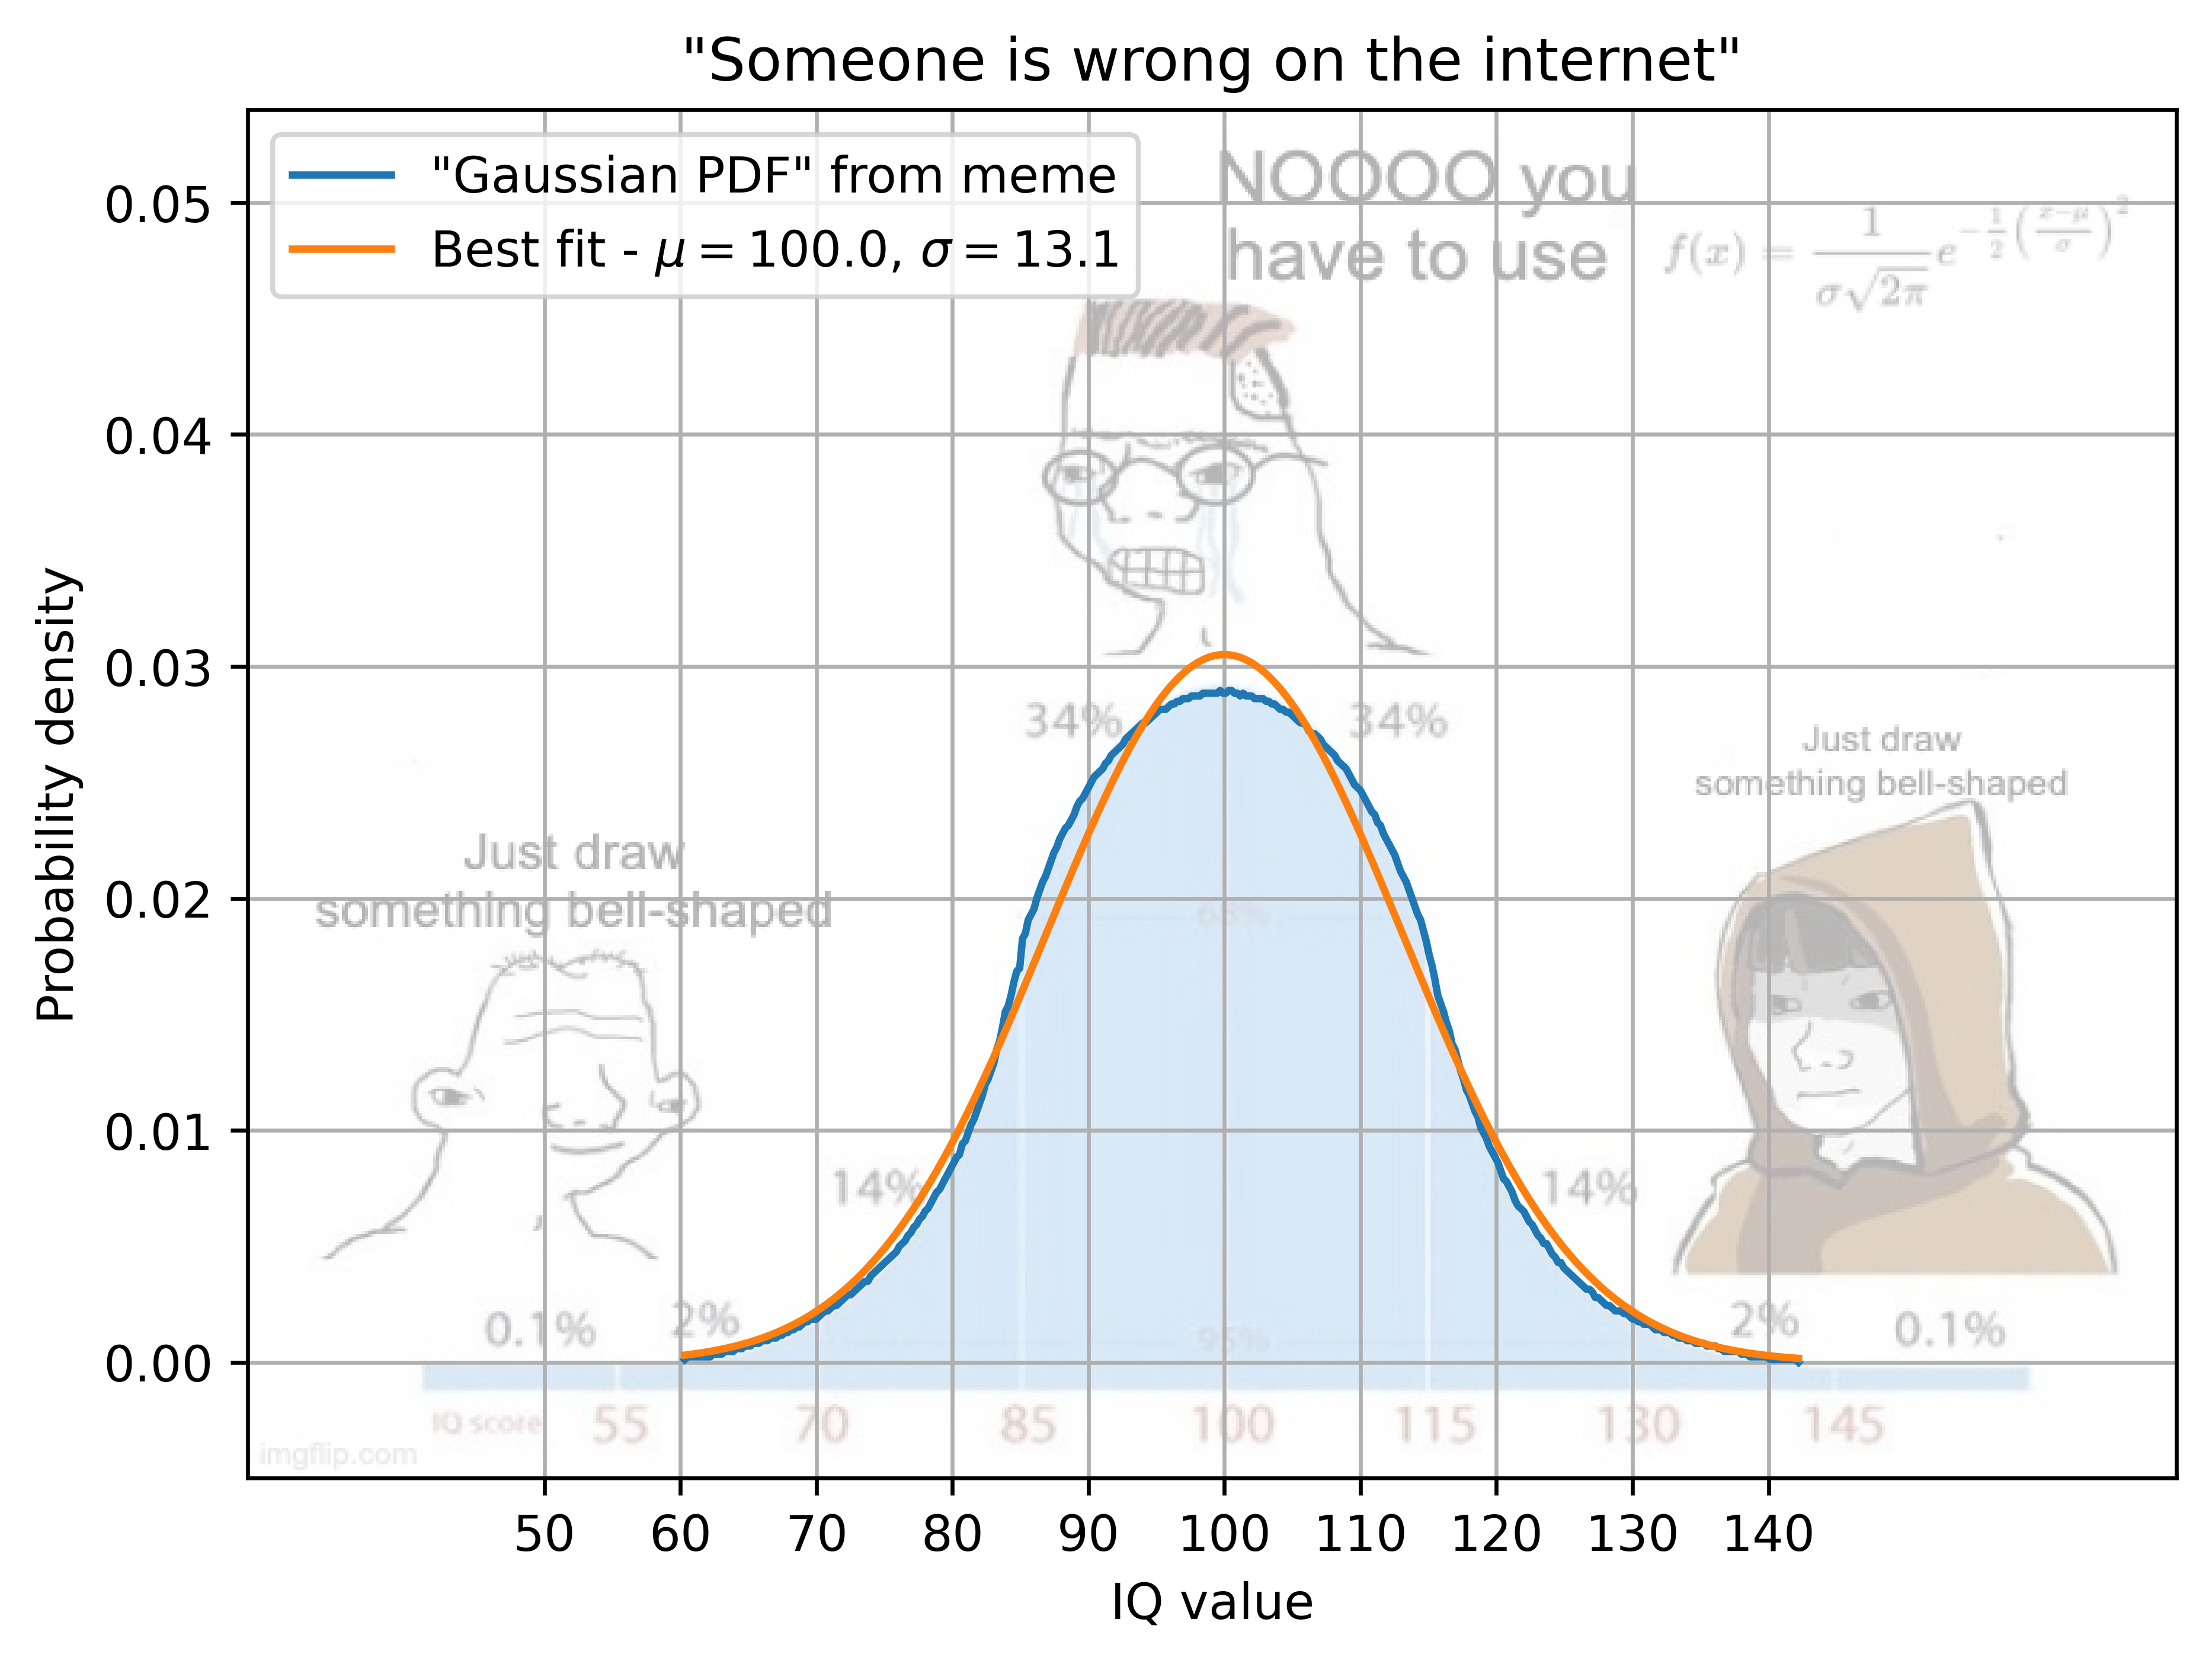
The Gaussian PDF in the meme template looked a bit off to me so I extracted the curve shape and did a least-squares curve fit of a Gaussian to it and turns out it is in fact wrong. Thanks for coming to my TED talk. Source for the meme template: imgflip. Tools used: GIMP for extracting an image of just the curve boundary, Python with PIL, numpy and matplotlib for the rest.
Posted by x5830
28 Comments
100IQ u/x5830 trying his best at statistics while 145 IQ wizard knows that real distributions never perfectly conform to theoretical models anyway.
Isn’t the whole representation of this bell curve that it’s a statistical estimation based on the population, and therefore, odds are, it would not be a completely perfect bell distribution? How many normal distributions are that flawless?
The real puzzle is what curve did they use in the original meme?
Mark my words there will be meta-content
Now that it’s in front of my eyes, the meme curve does seem wonky
Thank you for opening my eyes
That’s all well and good but maybe it just needs to be normalized?
And modern IQ scales are defined to be normal:
> IQ scales are ordinally scaled.The raw score of the norming sample is usually (rank order) transformed to a normal distribution with mean 100 and standard deviation 15.
https://en.wikipedia.org/wiki/Intelligence_quotient
What a nice talk, thank you.
When speaking of Bell curves I will bring Itzhak Bentov – I love this mans take on the evolution of minds.
[https://www.youtube.com/watch?v=9DbJ-7WvS6w](https://www.youtube.com/watch?v=9DbJ-7WvS6w)
Recommend his book, Stalking the Wild Pendulum.
According to which data did you find the sd to be 13.1 and mean to be 100?
Why didn’t you use a standard deviation of 15?
Wow, when you have both the blue and orange curves, it is painfully obvious the blue is not really Gaussian. Amazed I never saw it before (or is it faked here?).
I’ll take your word on it.
Does broseppi know that theoretical models dont perfectly replicate reality
IQ and the studies surrounding it are historically rooted in the Eugenics movement. We shouldn’t be using IQ anymore. It’s outdated and doesn’t represent a persons whole knowledge or ability.
Who’s gonna make a meme of this?
– Left side: Looks like a bell curve to me
– Middle: OP
– Right side: Most distributions aren’t really normal anyways
8 years on Reddit, makes first post to attack a popular meme template. Love it
Man I used to really respect these meme artists. NO MORE!
I’d like to remind everyone that IQ is a system created to give rationality to white supremacy
I just laughed for a solid minute. Fantastic.
IQ is race based pseudoscience from the start. It’s nose shape. It’s phrenology. The ‘distribution curve’ is a red herring argument.
wonderful meme is. my math sense is pleased
“The meme curve is fine bro” | “The meme curve is wrong!” | “The meme curve is fine bro”
Damn it you have a description
I wanted to comment “i smell matplotlib”
I’m 100 so no pressure to be great
also people’s heads aren’t shaped that way. what’s your point?
Someone give me a bellcurve of the IQ bellcurve accuracy.
The meme uses an actual bell shaped curve, a Gaussian is just “bell shaped”.
It pays to not look to closely here. The scores on the classic IQ tests have drift away from mean 100. New tests are mean 100 by constuction. All the scores have fat tails — as most natural data does. There would be various lumps on the left tail if the sample is large enough — due to the differences in various well-defined medical conditions. The right tail is unlikely to have lumps.