
I've always found these venn diagrams interesting, so I decided to make a 2025 version.
Notes on methodology:
-I'm using metropolitan statistical area (MSA) as defined by the US Office of Management and Budget and census metropolitan area (CMA) as defined by Statistics Canada (wikipedia: https://en.wikipedia.org/wiki/Metropolitan_statistical_area, https://en.wikipedia.org/wiki/List\_of\_census\_metropolitan\_areas\_and\_agglomerations\_in\_Canada)
-Metro assignments are based firstly on team name (if it contains the city name) and secondly on the location of the team's arena (if team name doesn't contain the city name).
-I'm using metro area instead of city due to the number of teams that play outside of city limits. Metro also just makes more sense for a lot of cases (i.e. Twin Cities)
-For the sake of simplicity and for the majority of cases, I just list the main city in the metro when referring to a metro (for example, I'll simply list 'Denver' when referring to the Denver-Aurora-Centennial MSA)
-To my knowledge, the Bay Area is the only case where I combined 2 MSAs and treated them as one (San Francisco and San Jose) due to proximity and culture
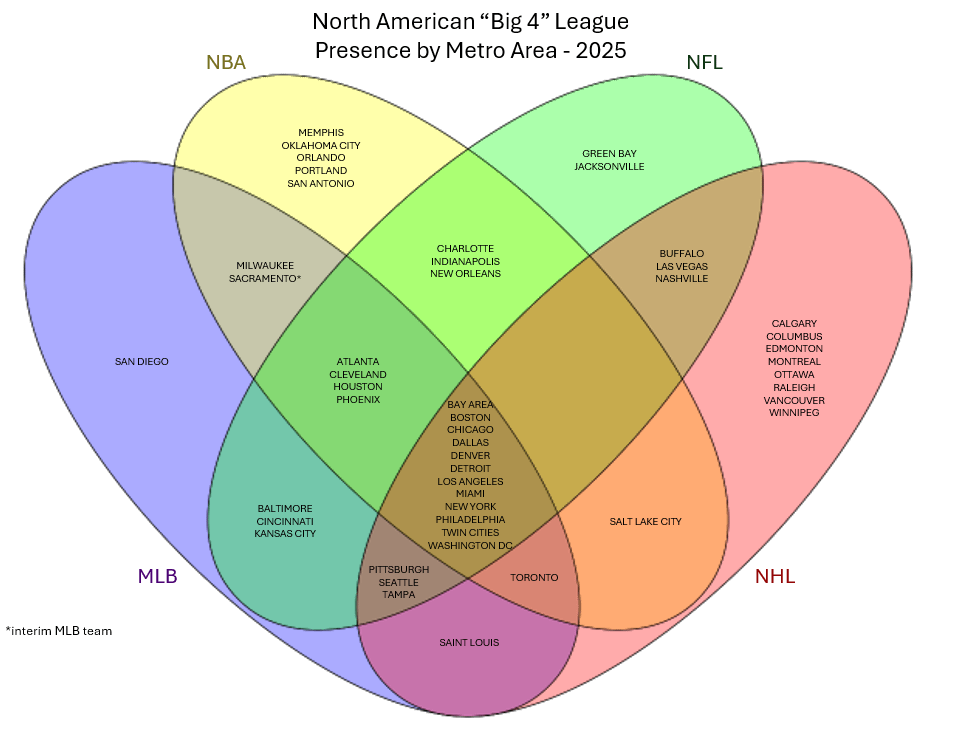
Observations:
-The only change from 2024 to 2025 was that Sacramento gained an (interim) MLB team.
-Green Bay is still the smallest metro area with at least one Big 4 team while Riverside (Inland Empire) is the largest metro without one. If you were to lump Riverside in with Los Angeles (like I did with the Bay Area), then Austin would be the largest metro without a Big 4 team.
-Denver is the smallest metro area with at least one Big 4 team from every league. Houston is the largest metro area that doesn't have at least one Big 4 team from every league.
Tools:
-Venn Diagram through Venny:
Oliveros, J.C. (2007-2015) Venny. An interactive tool for comparing lists with Venn's diagrams. [https://bioinfogp.cnb.csic.es/tools/venny/index.html](https://bioinfogp.cnb.csic.es/tools/venny/index.html)
-Excel, PowerPoint
Posted by shadratchet
17 Comments
This is awesome, nice work.
Data Sources:
-[https://en.wikipedia.org/wiki/Metropolitan_statistical_area](https://en.wikipedia.org/wiki/Metropolitan_statistical_area)
-[https://en.wikipedia.org/wiki/List_of_census_metropolitan_areas_and_agglomerations_in_Canada](https://en.wikipedia.org/wiki/List_of_census_metropolitan_areas_and_agglomerations_in_Canada)
-local Excel file
Tools:
-Venn Diagram through Venny 2.1
Oliveros, J.C. (2007-2015) Venny. An interactive tool for comparing lists with Venn’s diagrams. [https://bioinfogp.cnb.csic.es/tools/venny/index.html](https://bioinfogp.cnb.csic.es/tools/venny/index.html)
-Excel
-PowerPoint
Having all 4 or just having an NHL team (lots of Canadian cities) is most common. And no cities have NBA/NFL/NHL and no MLB.
Anaheim Ducks, and (historically) Anaheim Angels?
Get me away from the chili dog folk
Should add Oakland on its own outside of all the circles.
St. Louis with the best combo, sports year round with pre-season and playoffs overlapping between the two.
Long live the Seattle SuperSonics. Seattle will return to the center in due time.
Finally some good fucking food
Is Riverside bigger than Austin?
Edit: surprisingly, yes, by 2 million people. I would not have pegged Riverside as having over 4M people
Baltimore? The Ravens should be only NFL it’s distinct from Washington DC…
You should rank the cities by # of championship titles
Oakland recently wiped off the chart…
Also i see you did Bay Area instead of separating San Francisco and San Jose. 49ers and Sharks pretty geographicallly close
This is cool! Does it count winter homes? (Not a sport guy) but like- Yankees are in Tampa in the winter, Baltimore ravens are in Sarasota etc. guessing they don’t do that with basketball, but baseball for sure
This is really cool. Thanks for sharing
Using “Bay Area”, but not San Francisco while using “Boston” but not New England is bothering me in a weird way.
Fun fact: Raleigh is the only U.S. city with an NHL team, but without an NFL, NBA, MLB, or MLS team.
Truly a hockey town.