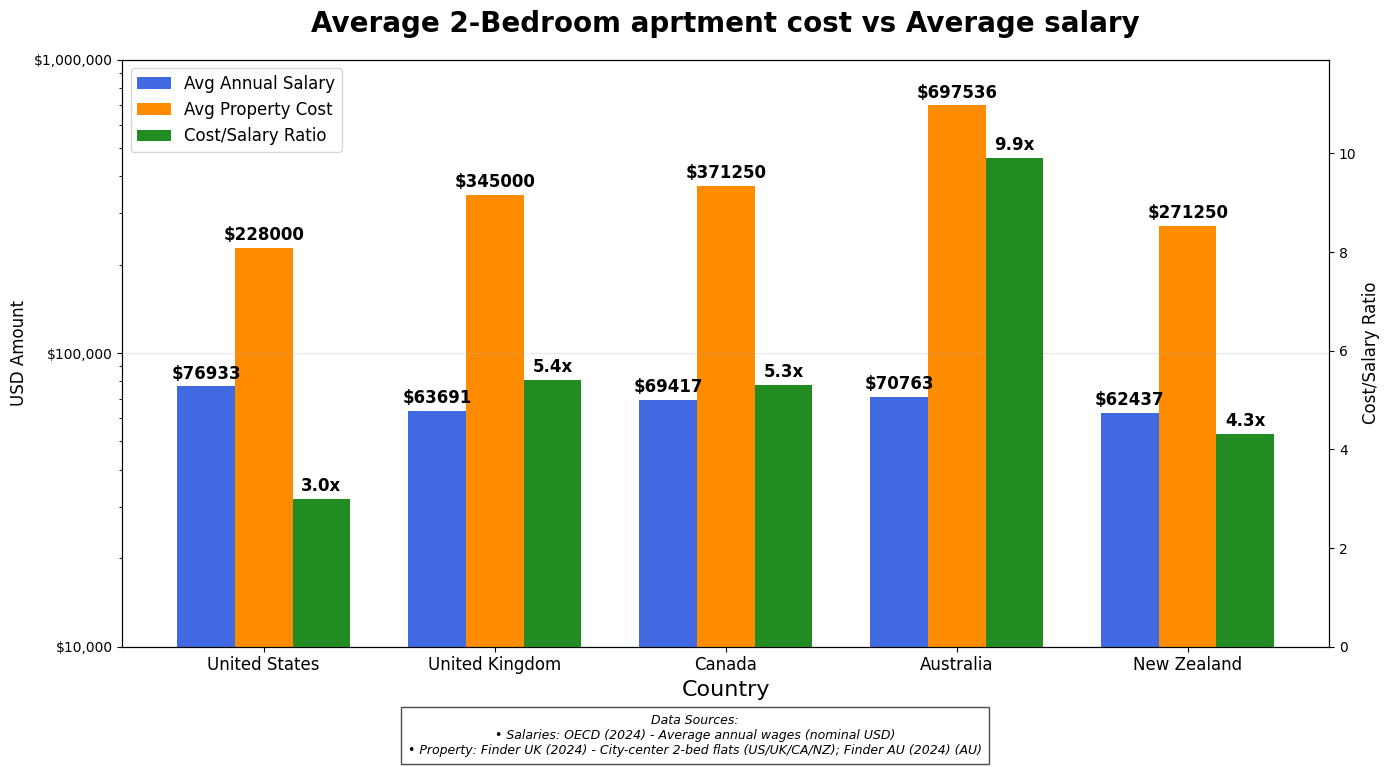
Note: This is national averages. Obviously it can vary. Especially in the US, where big coastal cities like New York, Los Angeles, San Francisco and Miami are on similar levels with Australia.
Posted by Rauram99

![Average cost for a 2-Bedroom apartment vs Average salary in the Anglosphere [OC]](https://www.byteseu.com/wp-content/uploads/2025/08/fcaht1blx8jf1-1024x565.png "Average cost for a 2-Bedroom apartment vs Average salary in the Anglosphere [OC]")
Note: This is national averages. Obviously it can vary. Especially in the US, where big coastal cities like New York, Los Angeles, San Francisco and Miami are on similar levels with Australia.
Posted by Rauram99
25 Comments
As you noted pointless to blend many of the countries as NYC is different that rural Nebraska.
Also average is rough due to super high earners, median would make more sense.
Finally, why 2 bed… I get along fine with just 1 even with a high income (saving / compound interest FTW).
Compared to Australia, Canada doesn’t look that bad. I thought Canada is basket case at this point as far as housing is concerned.
This doesn’t really pass the sniff test for me
This is useless data for the U.S. because outside of condos you cannot purchase apartments in the united states.
I love this sub. No matter what you post, the statistically illiterate will attack it. This shows what it shows. Yes it could show something different (pretax vs post-tax, exclude NYC and London, account for the number of power points per room, adjust for the color of the roof). But y’all are attacking a chart for presenting data. You don’t like the data. You might present different data. But does this coherently present what it presents – yes.
this data is not beautiful
How does australia function?
Iiiii, just dont think this ‘average annual salary’ metric tells us anything of interest. I expect its a weird measure that counts everyone in a household, or counts people working any hours as full time or something. Shit or even retirees, who grt means tested in aus.
Theres no WAY NZ is that close to Australia on any kind of basis. Theres no way the UK is that close to Aus.
Reddit really isn’t going to like this.
There’s no way Australia is that high?!
As a Canadian who has been füçked by the housing squeeze, all I can say is WTF, Australia?
Where are your torch and pitchfork brigades?
One of the worst graphs I’ve seen here. Most people should never use a log graph.
This is why God created Median.
You can’t use Average salaries. You need to use Median. Averages are heavily scewed by the 1%.
city-centre 2 bed flat is not what an average person in NZ would buy. most people live here in houses, all first home buyers would be trying to buy a house (in fact, banks require a significantly higher deposit to lend for an apartment as they have no land value or some are on leasehold title which can be unpredictable). here’s a source from the company that sets NZ house rates (i think they’re called land taxes in us?), so pretty authoritative. [https://www.qv.co.nz/price-index/](https://www.qv.co.nz/price-index/) (google tells me 909k nzd is 539k usd)
average nzd salary is about 70k, which is 41k in usd.
so the ratio is about 13x, not 4.3
realistically, people on 70k are unlikely to be buying a house, people with 100k upwards start saving. 100k nzd is 59k usd, so that makes it 9x
I’m very sceptical about that apartment price data.
NZ prices for example: https://www.trademe.co.nz/a/property/residential/sale/search?property_type=apartment&bedrooms_min=2
Nothing close $271k let alone it being the average. Eyeballing it looks closer to 600k.
It feels off. I blame the mixing of logarithmic and linear scales.
Interesting, as a nice “how can this be true” puzzle.
I thought Australia had so much empty space they lost a prime minister once. So it’s not land cost that’s driving up housing costs. What’s happening there?
You should link your source. Because your salary information does not match OCEDs website… non matter how you slice it nominal, ppp adjusted, etc.
This is nonsense.
That figure is the median income in NZ in **NZD**
That’s *$37,000* USD.
This is not a good way to use a logarithmic scale.
NZ 2 bed house prices which back in 2019 may have been 200k(USD).
But it’s more like 750-850k(NZD) now in 2024/2025. about 500k+ in USD.
Also our average salary isn’t 60k (USD) it’s actually 40k (USD).
I’m sorry, I don’t mean to disparage somebody’s work, but it makes no sense to do a national average for the US, a place as big as a fucking continent and varied as varied gets. United Kingdom also has London, which is a world within itself. It’s a start, but a nope from me, not that you need to give a crap about what i think
Don’t think that’s right for the UK. Our ratio is much higher.
NZ average house price is not $271000. In reality it’s closer to $450000