Source – https://stockanalysis.com/stocks/nvda/metrics/revenue-by-geography/
Tools – https://sankeydiagram.ai
Posted by _Gautam19

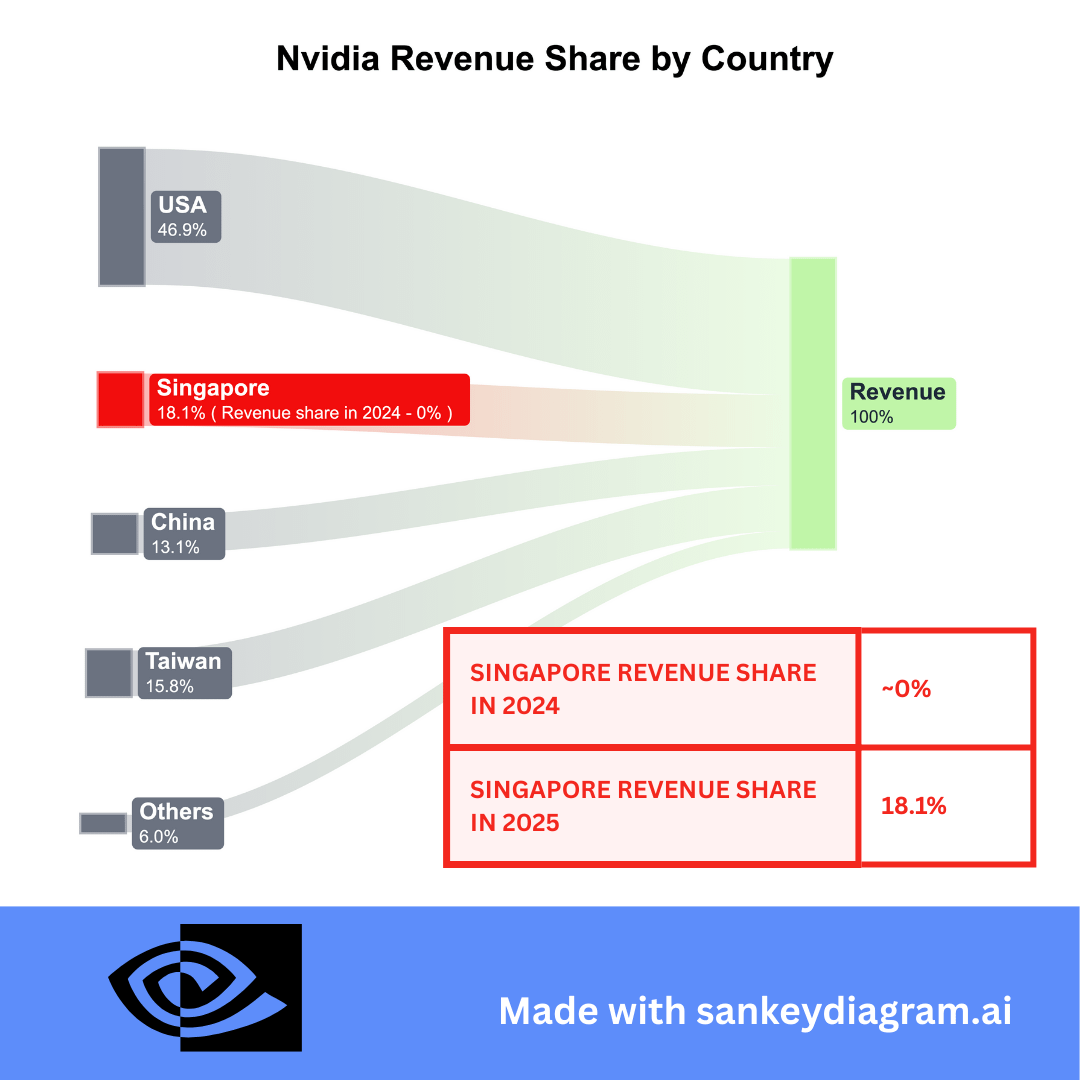
![[OC] Nvidia revenue share by country ( Singapore went from ~0 to 18% in 1 YEAR! )](https://www.byteseu.com/wp-content/uploads/2025/08/3bbc19yv19jf1-1024x1024.png "[OC] Nvidia revenue share by country ( Singapore went from ~0 to 18% in 1 YEAR! )")
Source – https://stockanalysis.com/stocks/nvda/metrics/revenue-by-geography/
Tools – https://sankeydiagram.ai
Posted by _Gautam19
8 Comments
China 31.2%, there easier to understand.
Oh wow that’s crazy that Singapore has such a rapidly growing data center industry crammed onto an island of only a couple hundred square miles /s
One eye open, one eye closed.
As electricity is very expensive in Singapore, I doubt that all these gpu are installed there… Production is mostly from fossil fuels.
On the other hand, it’s almost 3x cheaper in China…
This could have been a pie chart or a data table…
There’s no way to know where the money actually comes from.
It would be a better graph with simply two bar charts 2024 and 2025, if your message is about the increase in Singapore share. A Sankey with just the 100% brings nothing.
Be sure that there’s no change in scope in the reporting too (like was Singapore in Others in 2024?)
As I suspected, this is wrong, it’s a scope issue..
You should read the actual annual report, page 171.
[https://s201.q4cdn.com/141608511/files/doc_financials/2025/annual/NVIDIA-2025-Annual-Report.pdf](https://s201.q4cdn.com/141608511/files/doc_financials/2025/annual/NVIDIA-2025-Annual-Report.pdf)
You’re comparing revenues by billing location for 2025 vs Real Greographical Revenues for 2024
>*(1) Singapore represented 18% of fiscal year 2025 total revenue based upon customer billing location. Customers use Singapore to centralize invoicing while our products are almost always shipped elsewhere. Shipments to Singapore were less than 2% of fiscal year 2025 total revenue.*
On the Billing Location reporting, Singapore was 11% in 2024