
![[OC] Weekly Canadian Tourism to the US (2018-2025)](https://www.byteseu.com/wp-content/uploads/2025/08/nk4bu5bjerjf1-1536x639.png "[OC] Weekly Canadian Tourism to the US (2018-2025)")
Graphic by me, created in Excel.
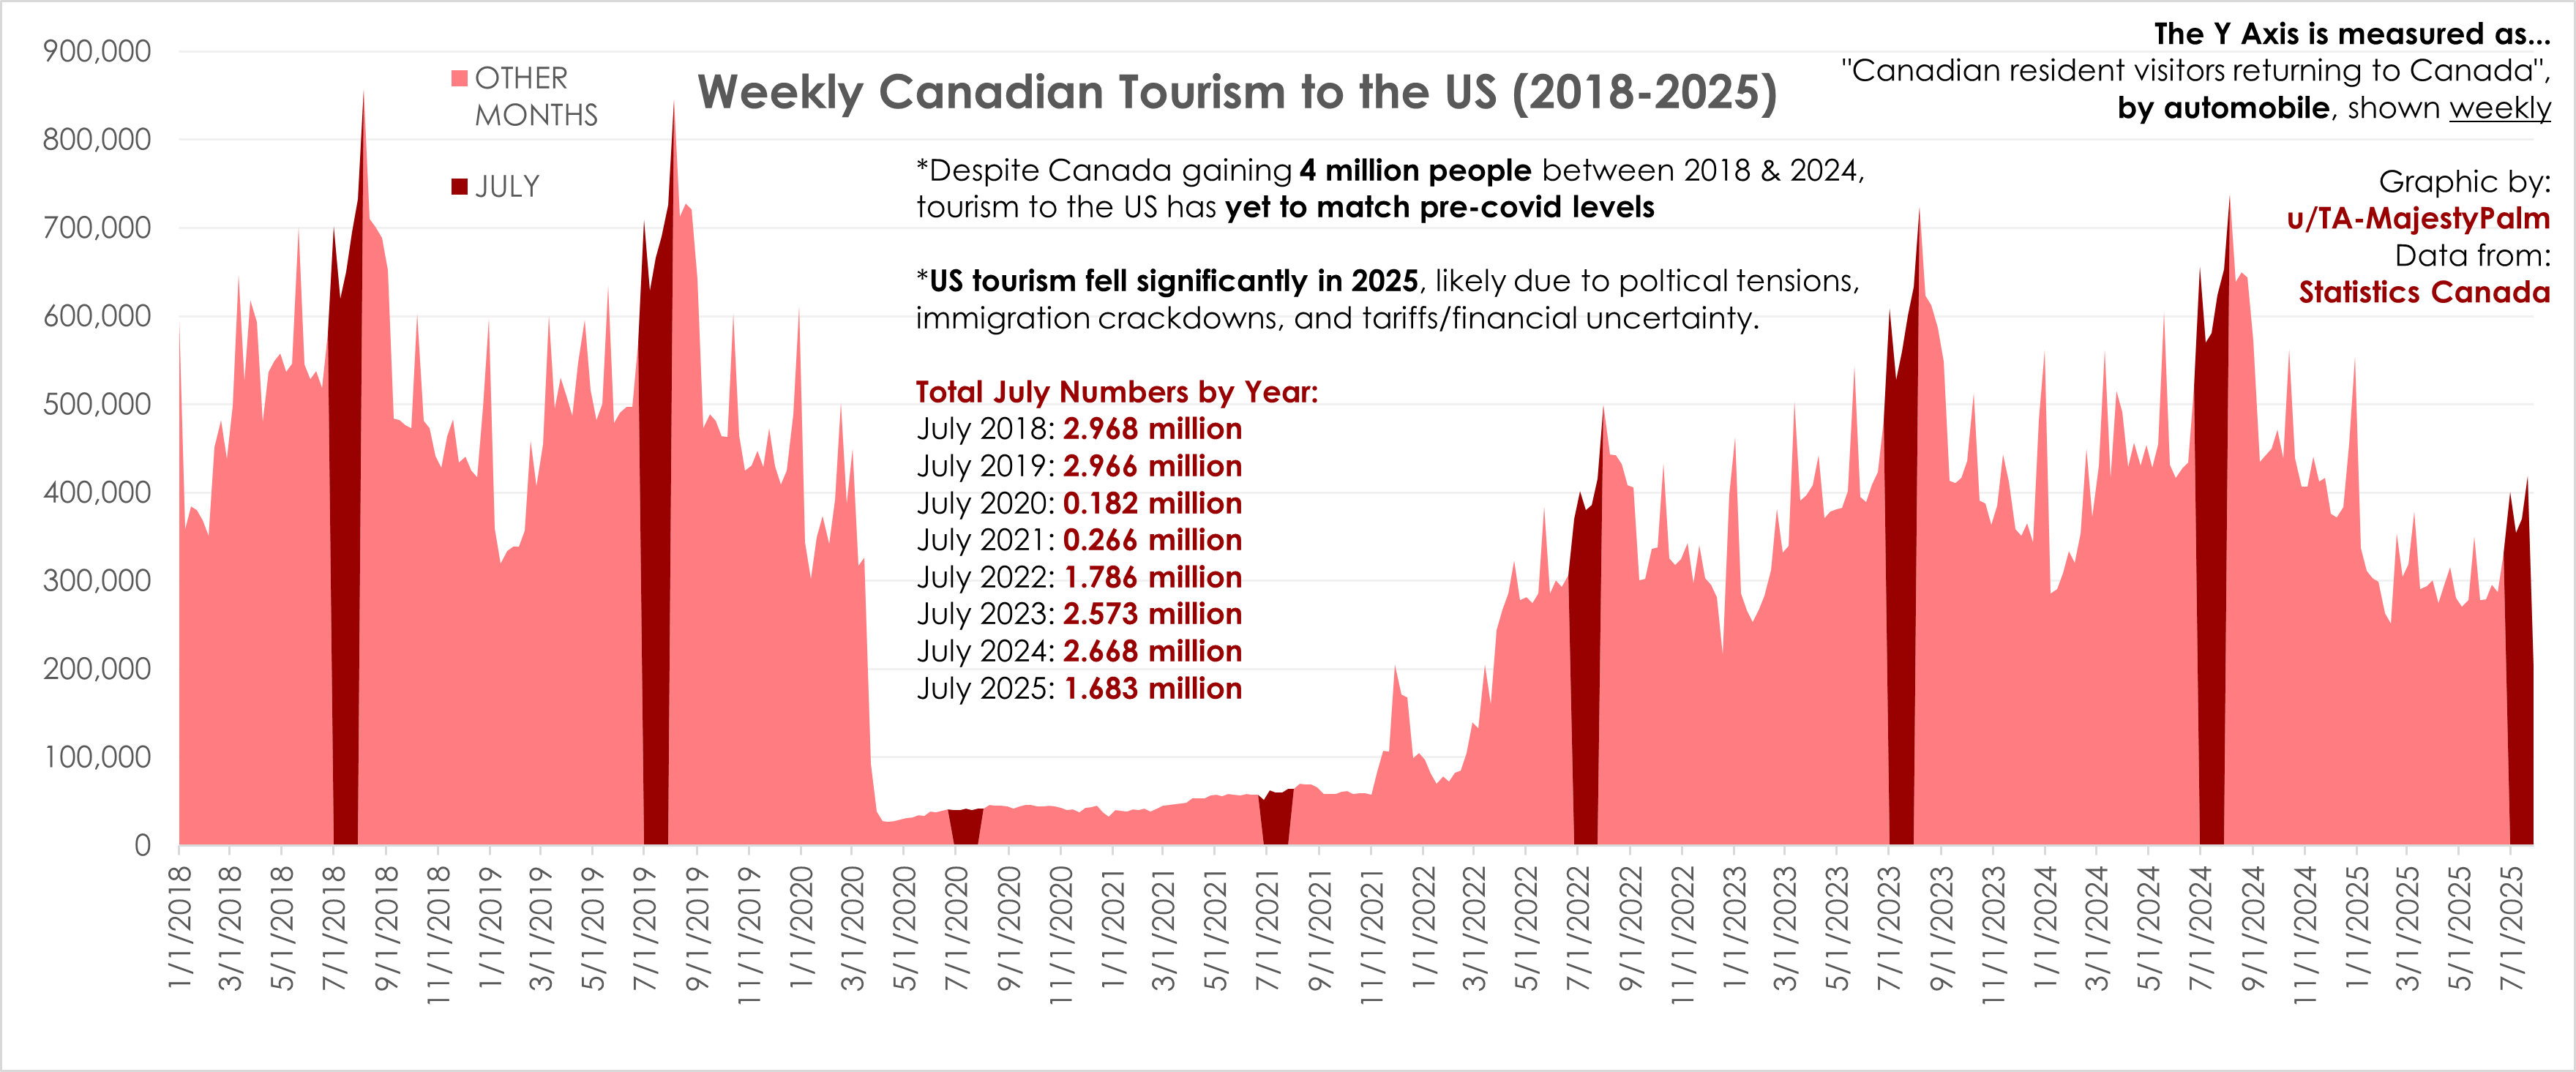
Source: https://www150.statcan.gc.ca/t1/tbl1/en/cv.action?pid=2410005701
As a trending news topic I wanted to investigate for myself how much Canadian Tourism to the US has recently declined, and how this compares historically.
The data source I used gives the daily number of Canadians returning from the US by car – I converted this to weekly totals as the daily graph had a lot of variance and was harder to read.
I highlighted every July for easier comparison.
Posted by TA-MajestyPalm
4 Comments
Required comment:
Graphic by me, created in Excel.
Source: https://www150.statcan.gc.ca/t1/tbl1/en/cv.action?pid=2410005701
As a trending news topic I wanted to investigate for myself how much Canadian Tourism to the US has recently declined, and how this compares historically.
The data source I used gives the daily number of Canadians returning from the US by car – I converted this to weekly totals as the daily graph had a lot of variance and was harder to read.
I highlighted every July for easier comparison.
TBH who the fuck would want to go the US at the moment.
Its a total shit storm
TIL Canadians don’t like COVID or Trump . . . which, well, fair enough.
I’d be curious to see the data going back to 2000.
Obviously the political climate is not the best for the tourism industry, but the exchange rate from CAD to USD is the worst it’s been since 2002. Coupled with the huge increase in cost of living since COVID, and I wouldn’t expect tourism to increase.