
6 Years ago, I posted a graphic about American home prices: https://www.reddit.com/r/dataisbeautiful/comments/dxgshs/the_booms_and_busts_of_american_home_prices_oc/
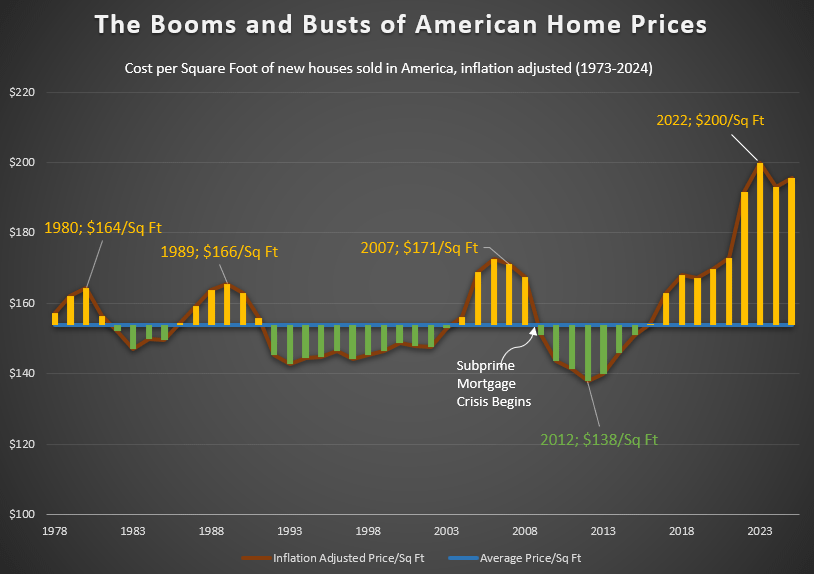
I have received many requests to refresh the data. Now that the Census data has been released for 2024, I am updating with newly provided information. Values are adjusted for 2024 inflation adjusted dollars. For some reason, I used 2010 inflation adjusted dollars in my last visualization.
Source: https://www.census.gov/construction/chars/current.html
Tools: Excel
Posted by WargFlow
5 Comments
**(Source)** [https://www.census.gov/](https://www.census.gov/)
**(Tool)** Data was downloaded into Excel and visualized using Excel.
The Average Price/Sq Ft is calculated using trend across time. This value hovers around $154/Per Square Foot.
Are we overdue for a dip again?
Is this graph saying that home prices were relatively stable, bouncing between $140 and $170/sq ft for 42 years between 1978 and 2020? I would have figured there would have been a steady increase, barring economic downturns.
Oh man those comments in the old thread about the impending bust are… Illuminating
Is this the cost to build or cost to buy? In LA, its just about normal to be $1000/sq ft at the moment