

Table 2 Main results on the effects of the EDCS reports the results of the benchmark model regression controlling for individual effect, time-fixed effect, and province effect (Province × Year) and introducing control variables such as GDP, the share of the secondary industry in GDP, industrial electricity consumption, and the green space area of urban parks. The explanatory variables in columns (1)–(4) are the logarithm of the EEL. Since the EEL is smaller after taking the logarithm, this study first expands the unit of the EEL by 100 times and then takes the logarithm when conducting the specific analysis. Columns (1)-(2) reflect the average treatment effect, and columns (3)-(4) reflect the dynamic impacts. From columns (1) and (2), it is found that under the influence of the EDCS, compared to the non-pilot provincial cities, the results from the average treatment effect show that the EEL in the pilot area, at the level of 1%, significantly increased.
In the dynamic effect, the EEL of the unit pilot area shows a meaningful influence during the implementation of the EDCS. The EEL of the unit pilot area significantly increased in 2016.
The regression results of the control variables show that the EEL sharply declines with the increase of the proportion of the secondary industry in GDP, showing that industrial pollution is the key concern of the EEL. Additionally, industrial thermal power consumption also hurts the ecological environment due to the production of industrial waste gas such as SO2. There is a highly positive correlation between the increase in GDP and the EEL because the regions with fast economic development in China pay more attention to the EEL, and the GDP also improves the EEL to a certain extent. The green space area of urban parks plays a positive role at the EEL, absorbing harmful gases, releasing more oxygen, and having the green island effect. Therefore, the EDCS has a dramatic benefit on the EEL of the areas in the sample.
Parallel trend assumption
The validity of the estimation results of the DID model relies on whether the parallel trend assumption is satisfied, i.e., whether the pilot area and the control group area have similar characteristics and trends before implementing the EDCS. This study draws on the treatment of Shi and Li44, using 2015, the pilot year of the EDCS, as the base year. Then, a separate OLS-DID regression consistent with the primary regression is conducted on the explanatory variables for the first three years and the last 2 years of the base year. Eventually, there is no significant difference between the EEL of the treatment group and the control group before the EDCS in Fig. 2, and the above results indicate that the DID in this article satisfies the parallel trend assumption.
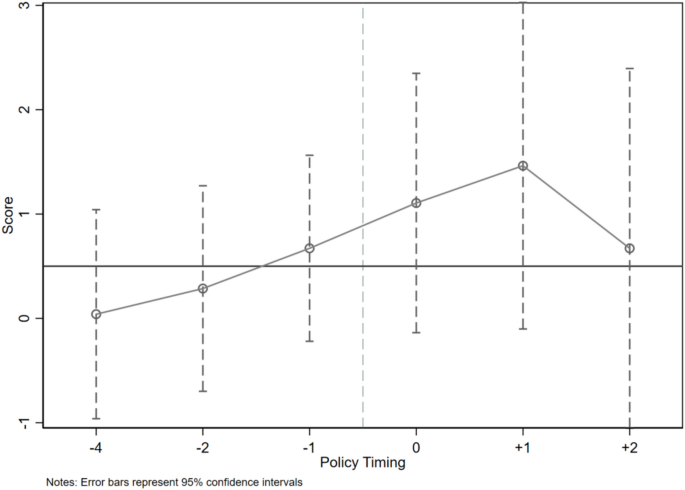
The parallel trend test of the EDCS.
The dynamic effect of the parallel trend test shows that the EEL shows a rapid increase in the first year after the base year, and there is no continuous effect.
Endogeneity test
Due to data limitations, omitted variables may exist, potentially introducing endogeneity into the regression analysis. To address this issue, we employ a partially linear instrumental variable model based on Double Machine Learning (DML), following Chernozhukov et al.45. The DML combines regularization techniques with multiple machine learning algorithms, enabling the automatic selection of effective control variable combinations. This approach offers significant advantages in variable processing and model estimation.
Using this framework, we split the sample in a 1:2 ratio and conducted regression tests. The results in Columns (1) and (2) of Table 3 reaffirm our baseline conclusions.
Robust analysis Alternative indicator
In this article, the PM2.5 is used as a proxy variable for the dependent variable to replace the EEL, which further verifies the effect of the EDCS. Where the PM2.5 data comes from the Atmospheric Composition Analysis Group of Dalhousie University, the concentration means data after matching the vector maps of prefecture-level cities through raster processing. The column (2) test results in Table 4 show that the EDCS reduces PM2.5 at the 1% significance level, indicating that the findings of this article will be strongly robust.
Placebo test
In order to further exclude the influence of other unobservable factors and ensure that the EDCS is a causal factor at the EEL, this study conducts a placebo test by randomly assigning pilot provinces. Specifically, 1000 random samples are taken from 284 cities in all 30 provinces in the sample, from which 63 cities are randomly selected as the treatment group and assumed to have implemented the EDCS. The remaining 121 cities are used as the control group in each sample. According to the baseline model regression again, the kernel density distribution of the explained variable of the EEL (see Fig. 3) shows that most of the sampling of the estimated coefficients of t-value less than 2, P-value is greater than 10%, which means that the results of the random sampling are not significant. Therefore, it can be concluded that the result passes the placebo test and that the impact of the EDCS on the EEL in the pilot area is not driven by other unobservable factors.
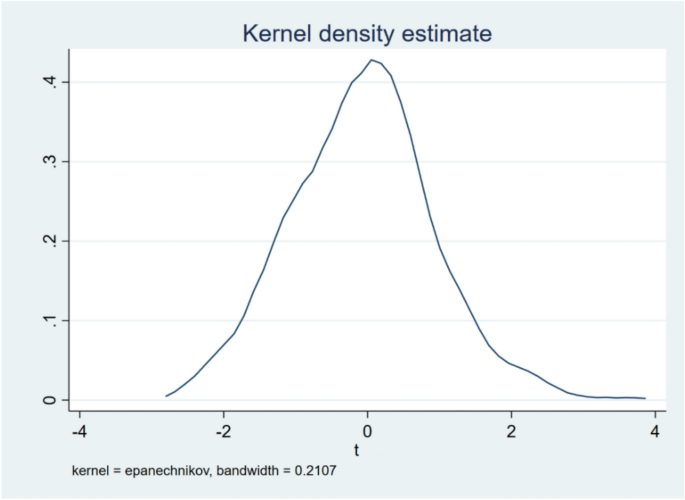
The Placebo test of the EDCS.
Propensity score matching (PSM) estimation
Due to the use of national city samples, there are many sample differences between cities, and in order to avoid the systematic differences and the risk of estimation bias46 in DID and to try to make the experimental group and control group as similar as possible in terms of their characteristics before the policy is implemented, this study further adopts the propensity score matching difference-in-difference (PSM-DID) method to conduct a robustness test.
Table 5 shows the regression results of the PSM sample, and the EDCS can effectively improve the EEL, which further argues for the robustness of this study’s findings.
Difference-in-difference-in-differences (DDD)
In order to exclude the interference of other policies so as to avoid the bias of estimation results caused by other policies in pilot and non-pilot areas, this study adopts the DDD method to overcome this problem. For example, in 2013, the State Council issued the ‘National Sustainable Development Plan for Resource-based Cities (2013–2020)’, which specifies 126 resource-based cities. Therefore, it can be grouped by resource-based cities, provincial capital cities, and key cities in the province, respectively, the DID results of each sub-sample, and then the differential. Ultimately, it can effectively eliminate the interference of other policies and other favorable factors in the study and get the net effect of the EDCS. Specific approach: Set up a new variable DDD; if the pilot cities belongs to the resource cities, the provincial capital cities, or the pilot of the key cities of the province, then assign a value of 1 to it, otherwise 0.
The final experimental results (see Table 6) show that the EDCS effectively improves the EEL, and the estimated coefficients are all at a 1% significance level. Ultimately, it effectively supports our previous research conclusions.
Robustness tests with adjusted policy timing
When selecting the timing for policy implementation in DID analyses, it is standard practice to base the timing on the official announcement of pilot programs by national authorities, particularly when policies are rolled out in batches at the national level. Studies typically use the year of the national announcement as the starting point for policy impact, rather than the specific implementation dates at the local level. For example, Ren et al.16 used 2007 as the baseline year for analyzing SO2 emission trading pilots, and Peng and Zhao47 directly adopted the national pilot announcement year for their study on rural collective property rights reform, without accounting for local implementation differences.
Given that the EDCS in pilot regions was implemented two years after the national announcement, we account for the delay between policy announcement and actual enforcement in our robustness checks. As shown in Table 7, the results remain consistent with our baseline conclusions.
Additional control variables
To account for potential factors influencing urban ecological quality, we include merchandise exports as a proxy for international trade and local fiscal expenditures within the general budget as a measure of local fiscal support. Even after controlling for these variables, the regression results remain robust in Table 8.
Heterogeneity analysis
The current resource development and ecological environmental protection are generally unbalanced and uncoordinated. In some areas, the intensity of resource development is high, the level of comprehensive utilization is low, and three high (high energy consumption, high pollution, high emission) projects abound, causing severe damage to the ecological environment. Resource-based cities have impacts on environmental protection policies due to differences in the level of resource endowment48, so it is of great practical significance to study the heterogeneous policy effect of the EDCS on resource-based cities and non-resource-based cities. Based on the Circular on the National Sustainable Development Plan for Resource-based Cities (2013–2020), which defines resource-based cities in China49, this article divides the sample area into two categories of resource-based and non-resource-based cities and conducts regressions by sub-sampling. The results of the analysis are reported in Table 9, where columns (1) and (2) show the policy effect of the EDCS on the EEL in resource-based cities, and columns (3) and (4) reflect the policy effect in non-resource-based cities.
It is easy to find that the EDCS significantly improves the EEL in resource cities. The effect on the EEL in non-resource cities is not significant, which may be due to the fact that non-resource cities have little environmental protection pressure, and the EDCS does not have a substantial impact on them.
Mechanism analysis
Previous analyses indicate that, compared to the control group, the EDCS significantly improved ecological quality in treatment regions. A natural follow-up question is: Through what channels does the EDCS influence ecological quality? This section explores this question by examining two potential pathways: Industrial structure transformation and Technological innovation.
Industrial structure
The EDCS is a form of environmental regulation that can effectively compel regions to undergo industrial transformation48. Industrial upgrading can break the “resource curse” and promote positive environmental outcomes50. As a key indicator of green development, ecological quality is influenced by industrial transformation, as demonstrated by Han et al.51, who measured the impact of industrial transformation on green development using total factor productivity. Thus, the EDCS may influence ecological quality through industrial transformation.
To test this pathway, we follow Gan et al.52 and use the proportion of secondary and tertiary industry output, as defined by Clark’s Law, to measure industrial structure upgrading. Our empirical design incorporates this metric to conduct mechanism tests.
After controlling for these variables, the baseline regression results in Table 10, Columns (1) and (2), provide insights into the moderating effects of industrial structure. Column (1) includes an interaction term between the EDCS and industrial structure, revealing a significant positive effect on regional ecological quality. This suggests that the EDCS’s impact is a combined effect of the policy and industrial structure. Column (2) introduces an interaction term between the EDCS and industrial upgrading, which also shows a significant positive effect, indicating that the policy’s influence is further amplified through industrial upgrading.
Figure 4 shows the nonlinear characteristics of the marginal contribution of industrial structure. The left figure shows that when the industry level is low (lnstructure1-w < 0.3), the policy effect is not significant; When the industrial upgrading reaches the threshold (lnstructure3w_ ≈ 0.4), the policy effect significantly increases, showing an accelerated growth pattern. The right figure shows that when the level of industrial upgrading is low (lnstructure2 < 1.2), the policy effect is not significant; When the industrial upgrading reaches the threshold (lnstructure2 ≈ 1.3), the policy effect significantly increases, showing an accelerated growth pattern.
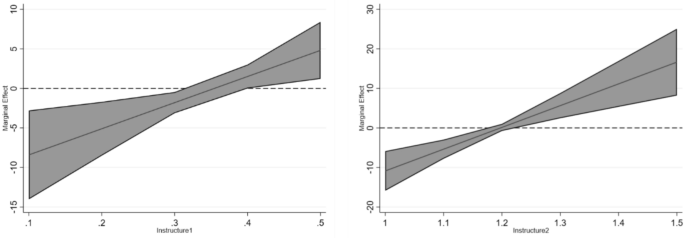
Average marginal effect plots (structure1 and structure2).
Technological innovation
The EDCS can stimulate an “innovation compensation” effect11, promoting regional technological progress and thereby supporting the Porter Hypothesis. As pollution control technologies advance, they can positively influence ecological quality. Cai et al.53 used the number of patent authorizations as a measure of corporate innovation. Drawing on this approach, this study examines whether the EDCS enhances regional EEL through the lens of authorized invention patents. Specifically, we use the total number of authorized invention patents, log-transformed for analysis.
Table 10 Column (3) shows that, after controlling for other variables, the interaction term between the EDCS and technological innovation has a significant positive effect on regional EEL. This indicates that the EDCS positively influences the EEL through innovation-driven pathways.
Figure 5 reveals the moderating effect of technological innovation. When at a lower level of innovation (Invent = 3), the policy effect is not significant, but when innovation is at a high level, the policy effect significantly increases, showing an accelerated growth pattern.
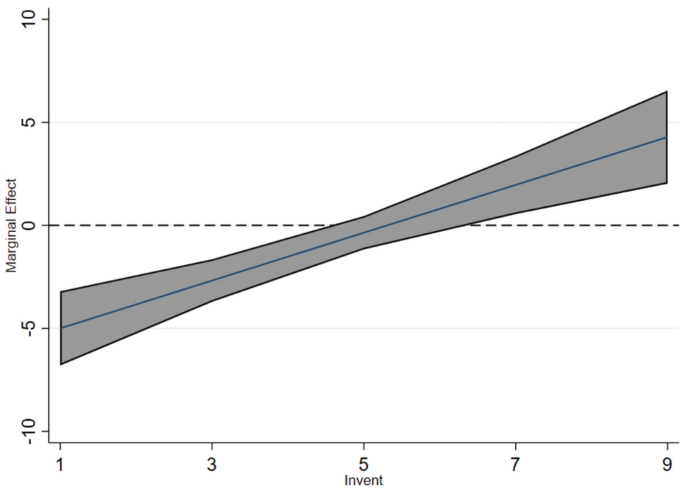
Average marginal effect plots (invent).