

This study analyzed data from a weighted sample of 3,927 women aged 15 to 49, of which 2,236 (56.94%, 95% CI: 55.41%, 58.51%) had utilized full package maternal health services. The average age of the respondents was 28.65 ± 0.1 years. Only one third (36%) had completed only primary education. Additionally, 2,193 (55.84%) women reported not using any contraceptive methods, and 2,176 (55.4%) hadn’t been told about pregnancy complication (Table 1).
Household level characteristics of study participants
Approximately 826 (21.03%) of the women were classified as the poorest, while 754 (19.2%) were categorized as the richest. Regarding household composition, 3,401 (86.6%) of the respondents lived in male-headed households, and 1,342 (34.17%) came from large families (Table 2).
Community level characteristics of study participants
This study included 305 clusters, with 2,900 women (73.84%) residing in rural areas. The Harari region had the lowest maternal health service utilization at 8 women (0.2%), while the Oromia region had the highest utilization, with 778 women (19.81%) (Table 3).
Spatial distribution of full package maternal health service utilizationSpatial autocorrelation analysis
At the regional level, Ethiopia showed significant spatial variations in maternal health service utilization (MHSU) rates. The spatial distribution analysis revealed statistical significance, with a Moran’s index of 0.686 and a p-value of less than 0.01 (Fig. 1).
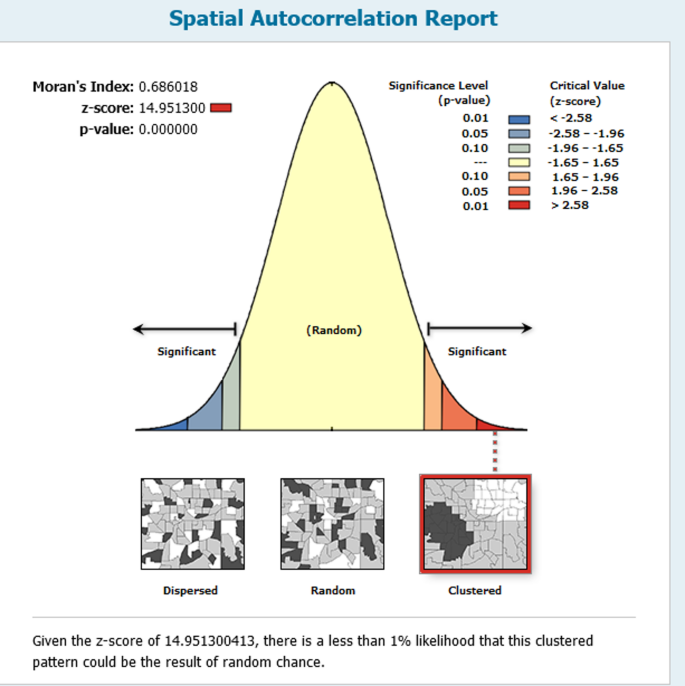
Spatial Autocorrelation report of FPMHSU in Ethiopia 2019 EDHS. The map was created by the authors using ArcGIS version 10.8 (https://www.esri.com/en-us/arcgis/products/arcgis-desktop/overview). The shapefile for Ethiopia’s administrative boundaries was obtained from https://data.humdata.org/dataset/cod-ab-eth, which is freely available for public use under the Humanitarian Data Exchange (HDX) open license.
Spatial distribution of full package maternal health service utilization
The spatial distribution of Full Package Maternal Health Service Utilization in Ethiopia exhibited significant variation across its zones. The highest utilization rates were found in Addis Ababa, Harari, Dire Dawa, EasternAfar region, Southern andEastern Amhara, Eastern Oromia region and southern parts of SNNPR, and western Benishangul Gumuz region. In contrast, southern parts of the Afar region,western parts of Amhara region, and most areas in the Somali region had lower rates of FPMHSU (Fig. 2).
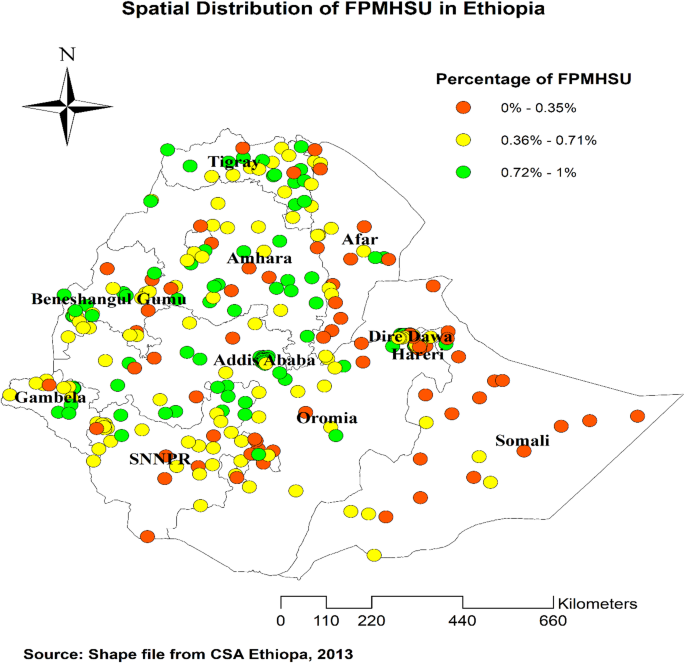
Spatial distribution of FPMHSU in Ethiopia 2019 EDHS. The map was created by the authors using ArcGIS version 10.8 (https://www.esri.com/en-us/arcgis/products/arcgis-desktop/overview). The shapefile for Ethiopia’s administrative boundaries was obtained from https://data.humdata.org/dataset/cod-ab-eth, which is freely available for public use under the Humanitarian Data Exchange (HDX) open license.
Local Morans I result of full package maternal health service utilization
As illustrated in the figure below, identifying significant neighborhood clustering is essential, including high clustering, low clustering, and spatial outliers (represented by red and green dots). High-High clustering refers to areas with high FPMHSU utilization surrounded by regions with similarly high utilization, while Low-Low clustering indicates areas with low prevalence surrounded by regions with similarly low prevalence. High-High clustering was observed in Addis Ababa, East Gojam, Gurage, Silte, and East Shewa parts of Ethiopia. Conversely, Low-Low clustering was found in Gamo Gofa, Wolayta, Sidama, Zone 3, and Zone 5 of the Afar region, where low utilization areas were surrounded by other low utilization areas (Fig. 3).
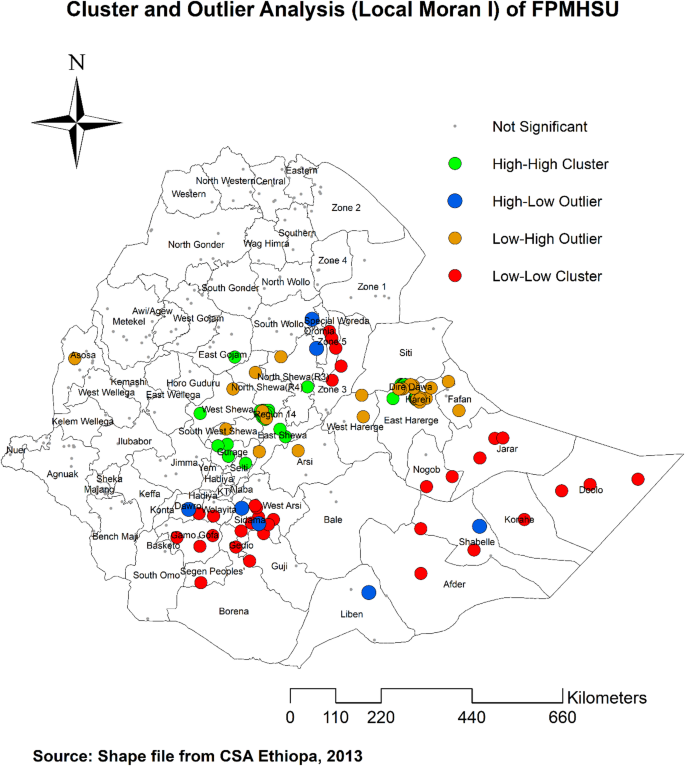
Local Moran I analysis of FPMHSU in Ethiopia 2019 EDHS. The map was created by the authors using ArcGIS version 10.8 (https://www.esri.com/en-us/arcgis/products/arcgis-desktop/overview). The shapefile for Ethiopia’s administrative boundaries was obtained from https://data.humdata.org/dataset/cod-ab-eth, which is freely available for public use under the Humanitarian Data Exchange (HDX) open license.
Gettis-OrdGi* statistics identification of full package maternal health service utilization
Hotspot analysis identifies regions with either high or low utilization of FPMHSU. Low-risk areas, indicated by green color, were found in Dire Dawa, Harari, Addis Ababa, East Shewa, West Shewa, Gurage, and Silte parts of Ethiopia. Conversely, regions such as Somali, Sidama, Gamo Gofa, and Gedo were identified as High risk areas as indicated by red color, characterized by low utilization of FPMHSU (Fig. 4).
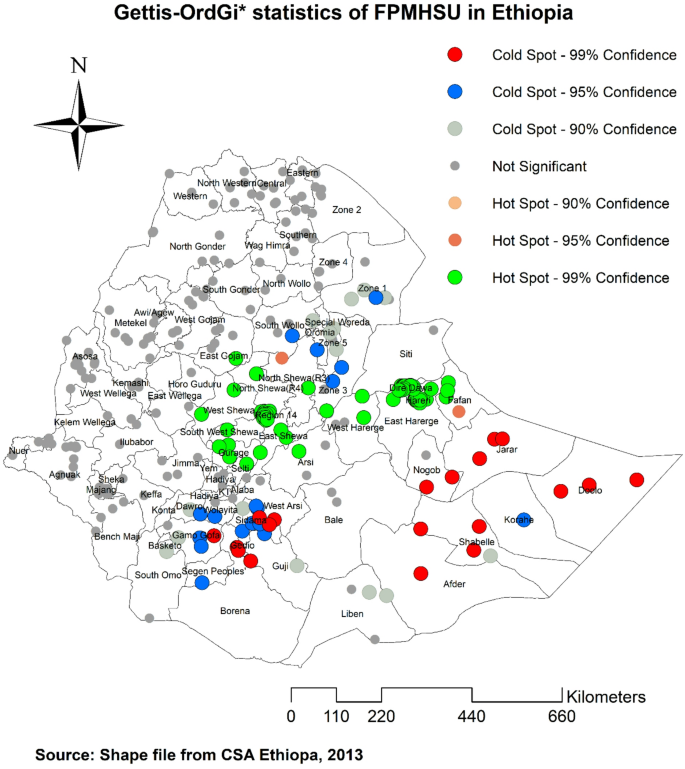
Gettis-OrdGi* statistics of FPMHSU in Ethiopia 2019 EDHS. The map was created by the authors using ArcGIS version 10.8 (https://www.esri.com/en-us/arcgis/products/arcgis-desktop/overview). The shapefile for Ethiopia’s administrative boundaries was obtained from https://data.humdata.org/dataset/cod-ab-eth, which is freely available for public use under the Humanitarian Data Exchange (HDX) open license.
Kringing interpolation of full package maternal health service utilization
Interpolation analysis predicted high FPMHSU utilization in areas such as East Shewa, West Shewa, Addis Ababa, Harari, and Dire Dawa. In contrast, the majority of areas in the Somali region were predicted to have low utilization of FPMHSU (Fig. 5).
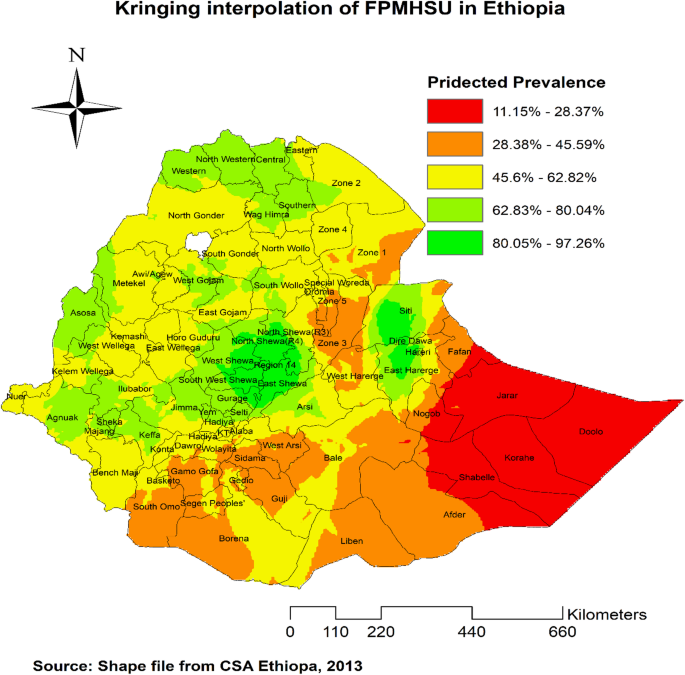
Kringing interpolation of FPMHSU in Ethiopia 2019 EDHS. The map was created by the authors using ArcGIS version 10.8 (https://www.esri.com/en-us/arcgis/products/arcgis-desktop/overview). The shapefile for Ethiopia’s administrative boundaries was obtained from https://data.humdata.org/dataset/cod-ab-eth, which is freely available for public use under the Humanitarian Data Exchange (HDX) open license.
Spatial scan statistics of full package maternal health service utilization in Ethiopia
Spatial scan statistics are highly effective in detecting clusters, offering more reliable results compared to other methods. In 2019, this analysis identified one primary and five secondary clusters of FPMHSU in Ethiopia. The primary cluster, with a log-likelihood ratio (LLR) of 71.62 and a p-value of less than 0.0000000001, encompasses Addis Ababa, the Amhara region, Tigray, Benishangul, and zones of the Afar region. This cluster is centered at (12.985634 N, 36.239465 E), with a radius of 558.56 km and a relative risk (RR) of 21.39 (Supplementary Table 1 and Fig. 6).
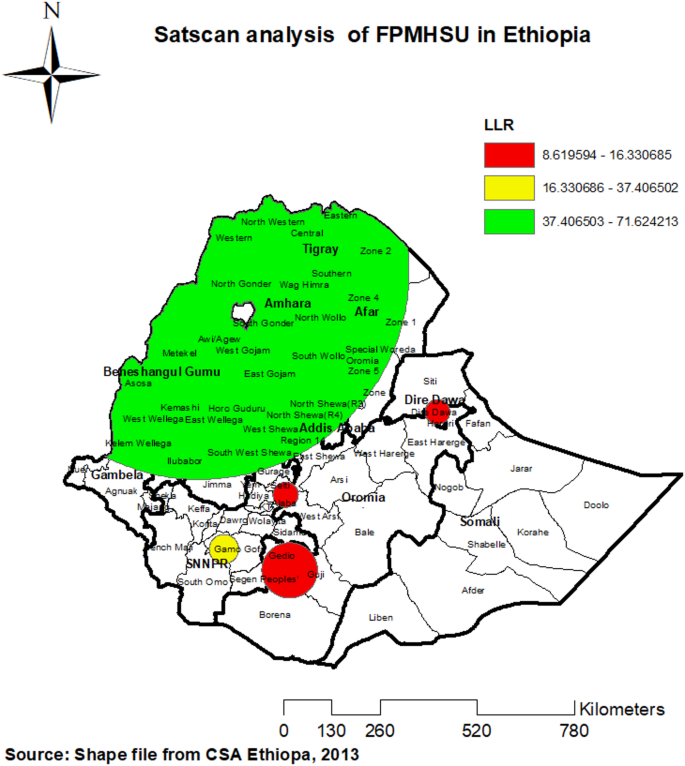
SaTScan analysis of FPMHSU in Ethiopia based on the 2019 Mini Ethiopian Demographic and Health Survey. The map was created by the authors using SaTScan™ version 10.1 (https://www.satscan.org/), and ArcGIS version 10.8 (https://www.esri.com/en-us/arcgis/products/arcgis-desktop/overview). The shapefile for Ethiopia’s administrative boundaries was obtained from https://data.humdata.org/dataset/cod-ab-eth, which is freely available for public use under the Humanitarian Data Exchange (HDX) open license.
Random effects
The random effects analysis revealed significant clustering in FPMHSU across communities in Ethiopia, as indicated by the intra-cluster correlation coefficient (ICC). The ICC in the empty model was 42.48%, suggesting that nearly 43% of the variation in FPMHSU could be attributed to differences between clusters or communities, highlighting the substantial role of contextual and community-level factors in the utilization of maternal health services. As individual- and community-level variables were added to the models, the ICC progressively decreased, reaching 19.99% in the final model, indicating that while predictors explained a large portion of the variation, unexplained community-level factors still played a significant role in determining FPMHSU.
The Proportional Change in Variance (PCV) showed a substantial reduction in variance from 2.43 in the empty model to 0.82 in the final model, indicating that much of the inter-community variability was explained by both individual- and community-level factors. This suggests that interventions targeting these factors could reduce disparities in maternal health service utilization. The Median Odds Ratio (MOR) in the models also reflected a decrease in cluster heterogeneity. The MOR was 4.02 in the empty model, decreasing to 2.33 in the final model, highlighting a reduction in unexplained variation with the inclusion of predictors.
Model fitness improved with the inclusion of predictors, evidenced by the log-likelihood increasing from -2238.02 in the empty model to -1878.90 in the final model. This improvement underscores the value of incorporating both individual and contextual factors to better explain and predict FPMHSU (Table 4).
Factors associated with full package maternal health service utilization (fixed‑effect)
This study identified several key factors influencing FPMHSU. Maternal age was significant, with women aged 20–24 years 35% less likely [AOR = 0.65, 95% CI (0.44–0.97)] to utilize the services compared to those aged 15–19 years. Married women were 54% more likely [AOR = 1.54, 95% CI (1.04–2.3)] to use FPMHSU than unmarried women. Muslim women being over twice as likely [AOR = 2.25, 95% CI (1.45–3.48)] to use the services compared to other religion follower women.
Women with primary education were twice as likely [AOR = 2.04, 95% CI (1.65–2.52)], and those with secondary education were 2.3 times more likely [AOR = 2.3, 95% CI (1.53–3.45)] to use the full package. Women with higher education had the highest likelihood, being six times more likely [AOR = 6.1, 95% CI (2.43–15.07)] to utilize the services. Awareness of pregnancy complications was also a key factor, with informed women 3.6 times more likely [AOR = 3.62, 95% CI (3–4.36)] to use FPMHSU.
Women having high parity 48% less likely [AOR = 0.52, 95% CI (0.4–0.69)] to use the services. Women from poorer households more likely to use the services, especially those in the richest category, who were 6.7 times more likely [AOR = 6.7, 95% CI (3.96–11.56)]. Finally, women living in rural areas were 47% less likely [AOR = 0.53, 95% CI (0.31–0.89)] to utilize FPMHSU compared to urban residents (Table 5).