
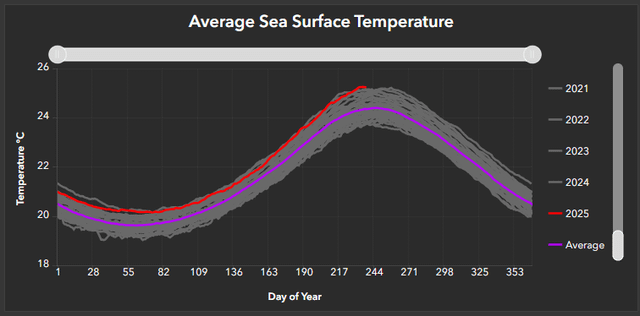
Hi everyone! This is a screenshot from my application which monitors average sea surface temperatures across every water body on Earth.
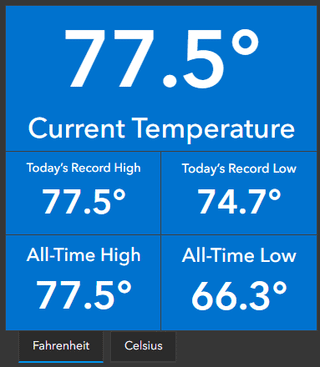
This example is for the North Pacific Ocean, which is currently the hottest it's been on record (since 1985!).
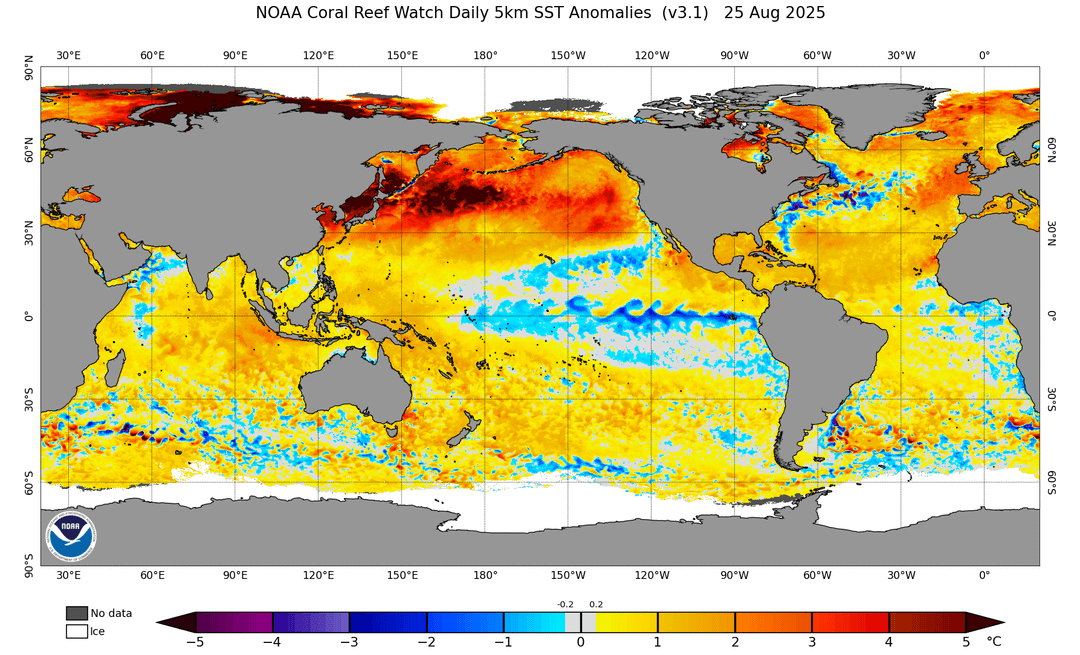
This data comes directly from NOAA Coral Reef Watch and is updated daily in my application.
Explore the live SST Tracker here: https://geomapit.maps.arcgis.com/apps/dashboards/06572b4963c149489fc080c142707abe
Posted by geomapit
6 Comments
I created and maintain this dashboard through ArcGIS Online. All data comes from NOAA Coral Reef Watch. Python is used to automatically perform updates. 🙂
With my dashboard, average sea surface temperatures can be seen at a global level and from individual water body levels.
From the opening 5 min of a disaster movie.
It’s in Celsius fake news /s
Why all the heat near Japan and russia?
Not your fault, but i really hate 0,360 instead of -180,180
Oh well the mass extinction is inevitable. Humans will survive not so much everything else