Share Facebook Twitter LinkedIn Pinterest Bluesky Threads [OC] US states rated by standard of living Posted by _crazyboyhere_
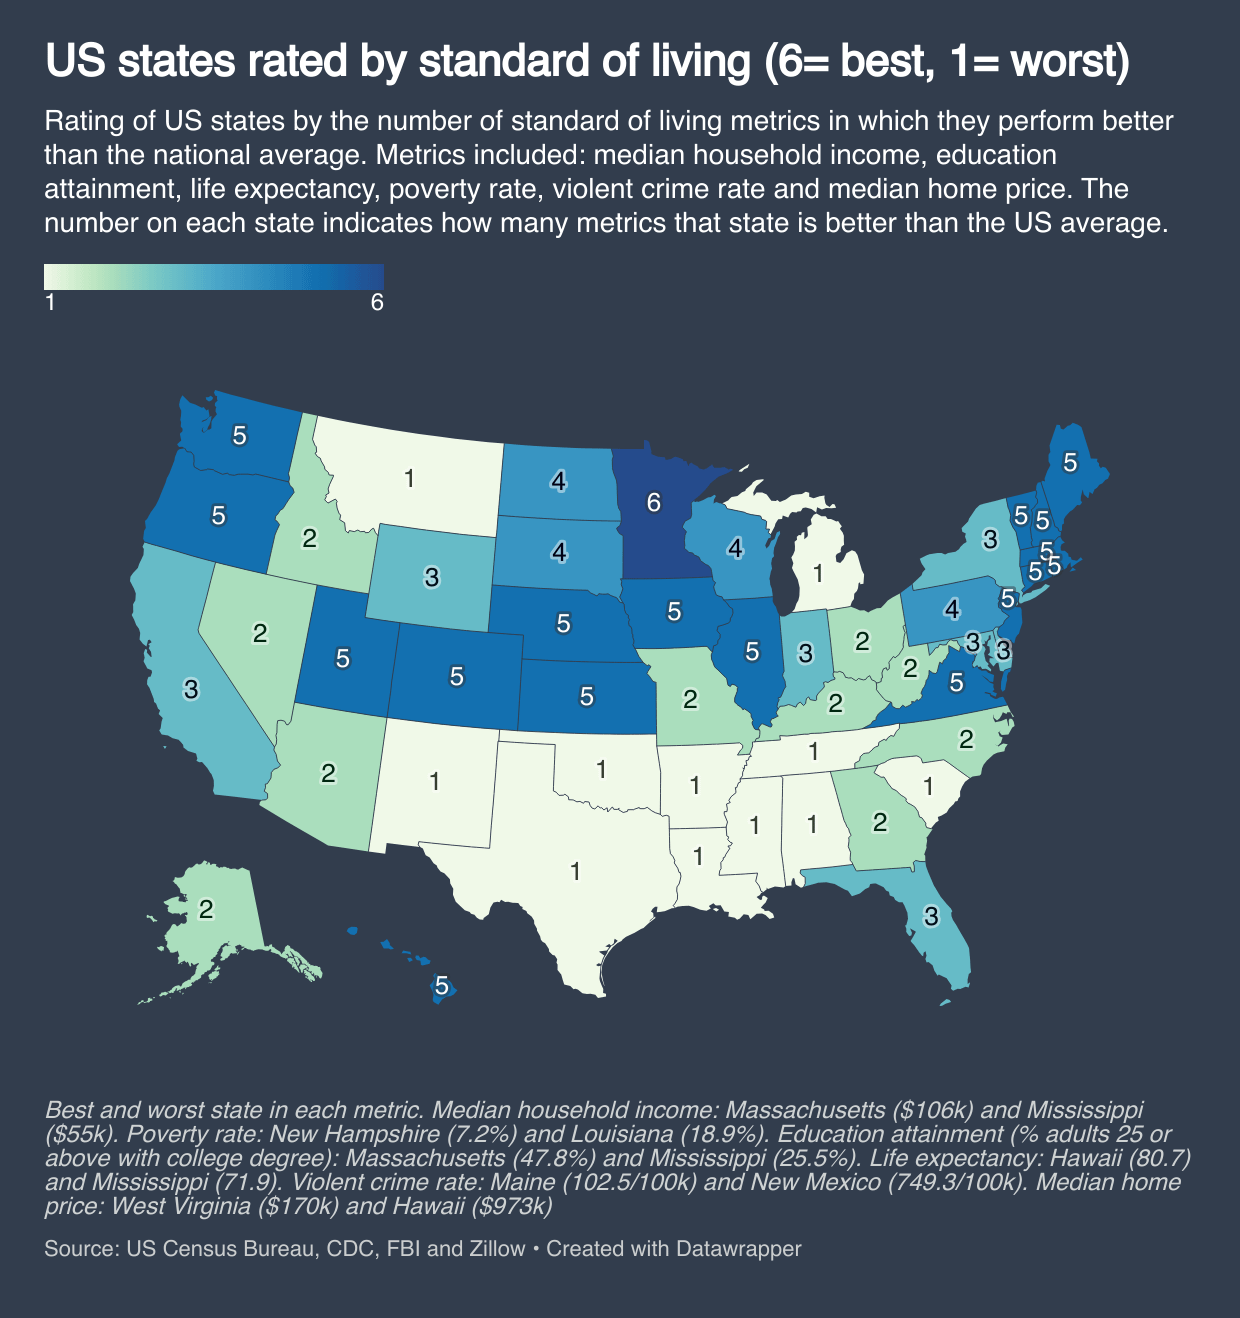
_crazyboyhere_ on August 28, 2025 11:51 am Sources: [Median household income](https://fred.stlouisfed.org/release/tables?rid=249&eid=259515#snid=259516), [Education attainment ](https://fred.stlouisfed.org/release/tables?eid=391444&rid=330), [Life expectancy ](https://www.cdc.gov/nchs/data-visualization/state-life-expectancy/index_2021.htm), [Poverty rate ](https://www2.census.gov/library/publications/2024/demo/acsbr-022.pdf), [Violent crime rate ](https://cde.ucr.cjis.gov/LATEST/webapp/#/pages/downloads) and [Median home price ](https://www.zillow.com/research/data/) Tools: [Datawrapper ](https://www.datawrapper.de/) For median household income, education attainment and life expectancy, being higher than the US average means better. For poverty rate, violent crime rate and median home price, being below the US average means better
HAM____ on August 28, 2025 11:56 am Yeah but have you seen 8 months of winter? Minnesota welcomes you
VUmander on August 28, 2025 11:56 am As a PA resident, I’m gonna call BS on any metric that has Iowa, Kansas, and Nebraska over us…and the Dakotas on the same level
amazingBiscuitman on August 28, 2025 11:57 am 17 fives and sixes, 11 ones. slightly over half the states are really great or really suck. i’d like to see a red/blue state overlay
TheChewyWaffles on August 28, 2025 11:58 am Paid for by the National Flyover States Association. Seriously seems a little surprising to me as someone from the Midwest
CiDevant on August 28, 2025 11:59 am What is driving Michigan so low? That’s kind of insane to me as a person who lives here. What is your methodology? Is this just the aggregate of times it’s higher than the average across all categories or is this an average of all scores?

![[OC] US states rated by standard of living](https://www.byteseu.com/wp-content/uploads/2025/08/8z6m18b41rlf1-963x1024.png "[OC] US states rated by standard of living")
7 Comments
Sources: [Median household income](https://fred.stlouisfed.org/release/tables?rid=249&eid=259515#snid=259516), [Education attainment ](https://fred.stlouisfed.org/release/tables?eid=391444&rid=330), [Life expectancy ](https://www.cdc.gov/nchs/data-visualization/state-life-expectancy/index_2021.htm), [Poverty rate ](https://www2.census.gov/library/publications/2024/demo/acsbr-022.pdf), [Violent crime rate ](https://cde.ucr.cjis.gov/LATEST/webapp/#/pages/downloads) and
[Median home price ](https://www.zillow.com/research/data/)
Tools: [Datawrapper ](https://www.datawrapper.de/)
For median household income, education attainment and life expectancy, being higher than the US average means better.
For poverty rate, violent crime rate and median home price, being below the US average means better
What happened to you Michigan
Yeah but have you seen 8 months of winter? Minnesota welcomes you
As a PA resident, I’m gonna call BS on any metric that has Iowa, Kansas, and Nebraska over us…and the Dakotas on the same level
17 fives and sixes, 11 ones. slightly over half the states are really great or really suck. i’d like to see a red/blue state overlay
Paid for by the National Flyover States Association.
Seriously seems a little surprising to me as someone from the Midwest
What is driving Michigan so low? That’s kind of insane to me as a person who lives here. What is your methodology?
Is this just the aggregate of times it’s higher than the average across all categories or is this an average of all scores?