
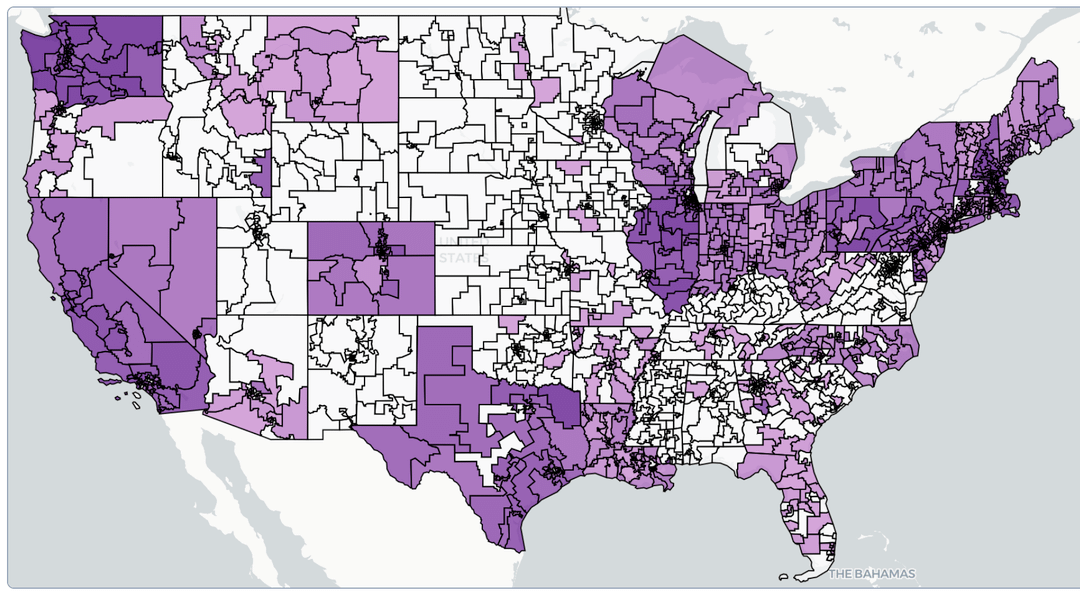
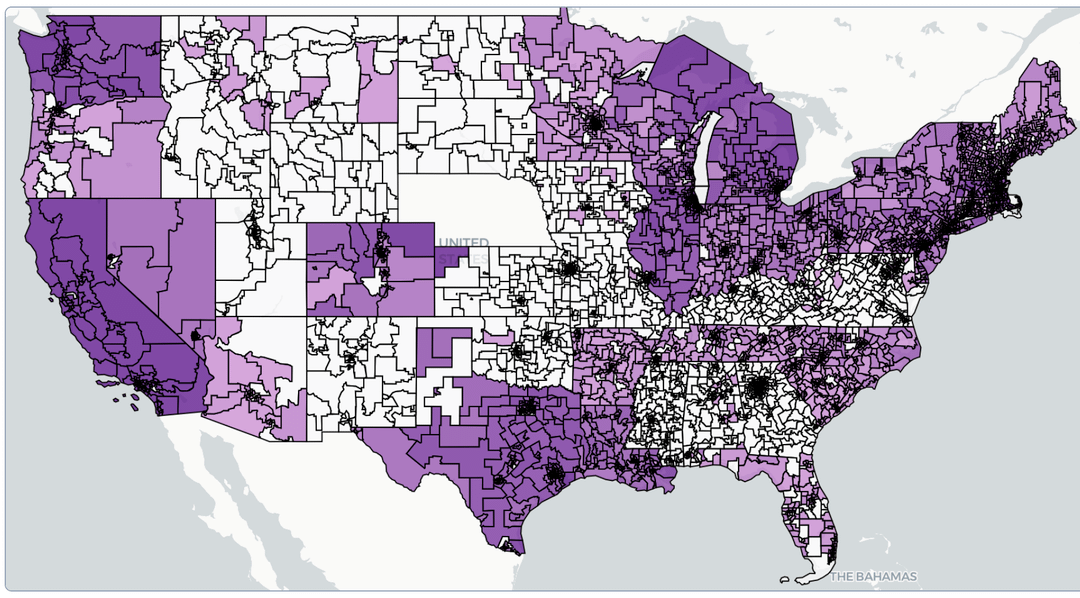
![[OC] - How many bills have your legislators sponsored this year so far? Darker = more bills](https://www.byteseu.com/wp-content/uploads/2025/08/g3x2susc7vlf1-1024x567.png "[OC] – How many bills have your legislators sponsored this year so far? Darker = more bills")
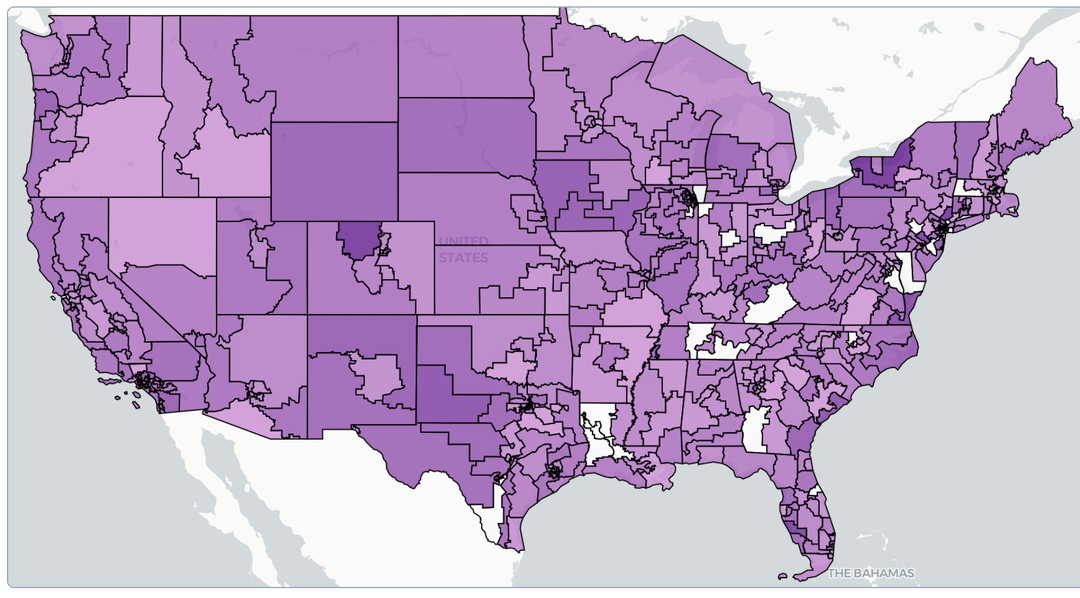
StatePulse interactive dashboard: https://www.statepulse.me/dashboard -> districts -> toggle representative heatmap on
Pic 1: Congress (U.S. House)
Pic 2: State upper chamber
Pic 3: State lower chamber
Using a database of legislation (250k+ bills), I counted how many bills each representative sponsored and assigned each amount to their geographical locations respectively, displayed as a gradient of purple. Note that many states' legislative chambers have not been in active session this year so far.
If I missed anything, please let me know 🙂
StatePulse is also a free/open source platform that tracks legislation, representatives, and political trends. I believe that as many people should have access to what's actually being passed in legislative chambers as possible, especially considering how polarized the environment has become. As an incoming college freshman majoring in Computer Science, I think technology can be a great aid in helping regular folks like me learn.
Source code below; donations are also appreciated!
Github repo: https://github.com/lightningbolts/state-pulse
Buy me a coffee: https://buymeacoffee.com/timberlake2025
Special thanks to: OpenStates for their legislative data/scrapers, Congress for providing a free public api, MapLibre GL for map rendering, and more!
Posted by TheMatrix2025
5 Comments
That dark spot in northern Colorado is my rep, Joe Neguse!
The districts being so clustered in big cities along with the boundary lines being kind of thick and black makes it look like representing urban/suburban areas is correlated with sponsoring more legislation.
But really interesting data set to work off.
This is not beautiful. Needs insets for NYC, Chicago & LA
Some states haven’t been in active sessions this year? We are in August. How is that possible?
WTH happened to Michigan and the Great Lakes?