
![[OC] I analyzed Meta's VR/AR hiring blitz: 2,207 job postings in 3 months reveal $5.6B annual investment. 58% of Meta's hiring is VR/AR, with 74% at L4-L5 levels targeting mid-senior professionals.](https://www.byteseu.com/wp-content/uploads/2025/09/36nwpln2wimf1-1536x768.jpeg "[OC] I analyzed Meta’s VR/AR hiring blitz: 2,207 job postings in 3 months reveal $5.6B annual investment. 58% of Meta’s hiring is VR/AR, with 74% at L4-L5 levels targeting mid-senior professionals.")
Data Source:
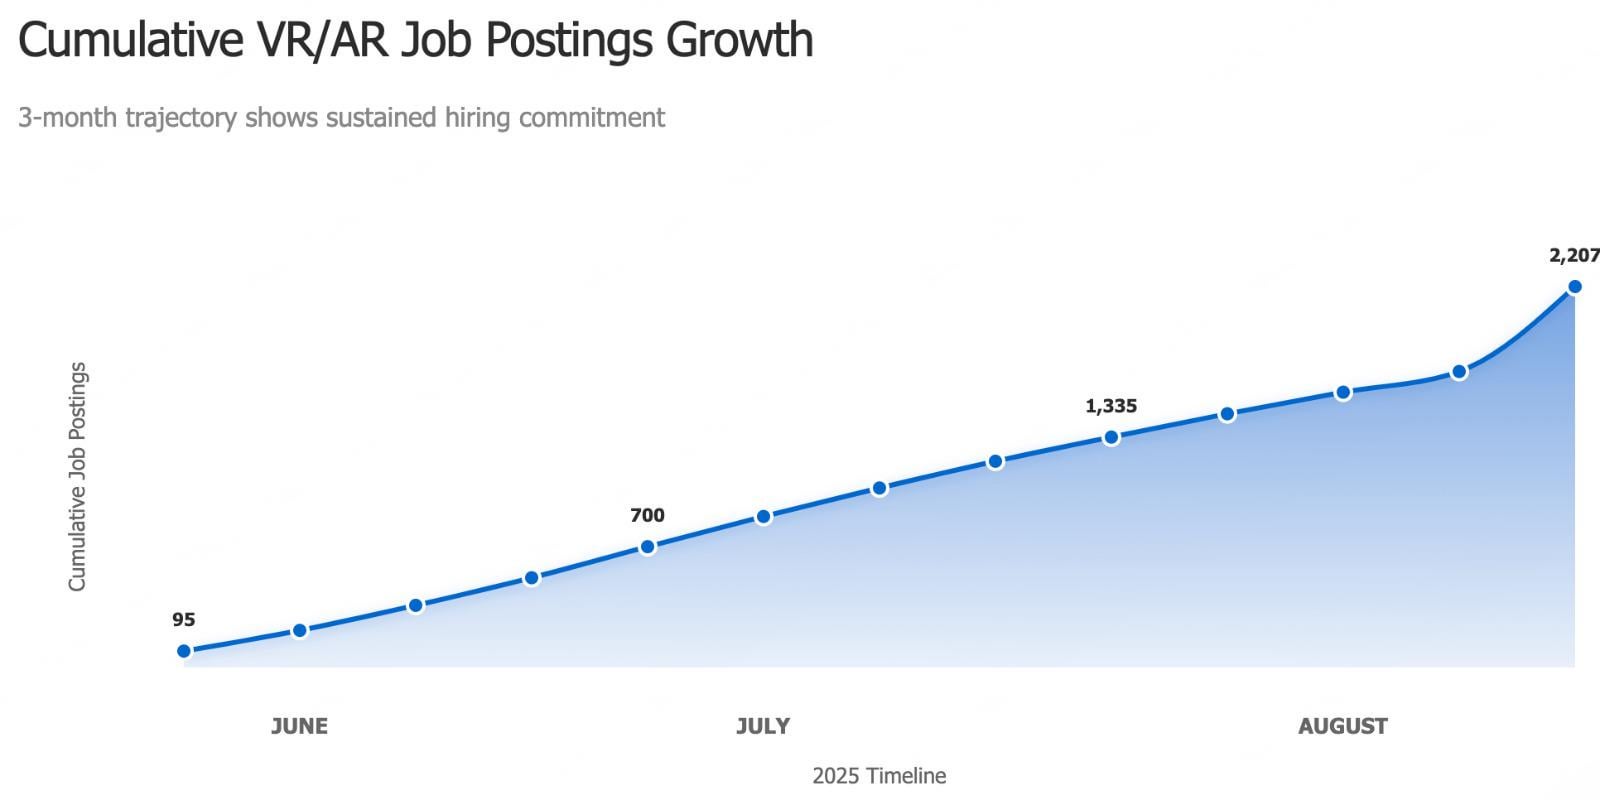
Meta VR/AR job postings from June-August 2025, extracted from BigQuery jobs database aggregating LinkedIn and other major job board APIs. Dataset includes 3,793 total Meta postings with salary data available for 99.9% of positions (2,204 of 2,207 VR/AR roles). Analysis covers complete 3-month hiring cycle with weekly granularity.
Tools Used:
- OpenAI GPT-4o-mini for VR/AR job classification and Meta leveling band analysis using 100 concurrent workers
- D3.js for interactive treemaps, stacked area streamgraphs, horizontal bar charts, and donut visualizations
- BigQuery for data extraction, filtering, weekly aggregation, and salary-based investment calculations
- Python with pandas for data processing, statistical analysis, and geographic consolidation
- Custom NY Times color palette (#326891, #cc3333, #2d7d32, #f57c00) for professional visualization consistency
- Material Design principles for chart shadows, smooth transitions, and collapsible section navigation
Methodology:
- Filtered to include VR/AR-specific roles using AI analysis of job titles and descriptions (Reality Labs, spatial computing, computer vision, haptics, Quest, Oculus, metaverse, immersive experiences keywords)
- Salary range analysis with investment calculation using total compensation × 3x multiplier (industry standard for loaded employee cost including benefits, equity, facilities, overhead)
- Leveling classification into Meta's actual system (L3-L8 individual contributors, M1-M2 managers, Director+) based on job responsibilities, years of experience, and compensation ranges
- Geographic consolidation: Bay Area cities (Menlo Park, Sunnyvale, Burlingame, San Francisco) combined, Seattle metro area (Redmond, Bellevue, Seattle) combined for regional analysis
- Each posting classified into 12 mutually exclusive VR/AR technology categories based on keyword matching and job function analysis
- Weekly trend analysis showing hiring momentum patterns across 13-week period
Chart hierarchy:
- Technology categories = Investment allocation
- Geographic regions = Talent concentration strategy
- Leveling bands = Career ladder distribution
- Weekly timeline = Hiring momentum patterns
Only categories with statistical significance included for accuracy and clarity
Key Insights:
- VR/AR hiring dominance: Meta allocates 58% of total hiring to VR/AR roles (2,207 of 3,793 postings), projecting to 8,800+ annual VR/AR positions
- Foundation-first investment strategy: Core Platform & OS ($289M) plus Hardware & Devices ($243M) receive 38% of total people investment, indicating platform control priority
- Leveling concentration reveals talent strategy: 74% hiring at L4-L5 levels with base salaries ($185K-$237K), but Meta stock at $738+ makes total compensation 2-3x higher through RSU packages
- Geographic diversification beyond Silicon Valley: Bay Area leads (41%, $580M) but significant NYC (24%, $342M) and Seattle (22%, $304M) investments show strategic talent hedging
- Premium skills alignment with AR pivot: Firmware development and AI/ML roles command highest compensation, supporting sophisticated AR device development requiring hardware-software integration
- Market contradiction: Aggressive hiring despite $17.7B Reality Labs losses suggests long-term platform commitment over short-term profitability optimization
Technical Notes:
- Collapsible section architecture with smooth expand/collapse animations for progressive disclosure and improved navigation experience
- Clean flat color implementation following NY Times data visualization editorial standards (removed gradients for professional newspaper-style appearance)
- Dual-line bar chart labels displaying both job posting counts and investment amounts for comprehensive context in single visualization
- Interactive tooltip system with Meta leveling details, base salary ranges, and estimated total compensation including RSU value calculations
- Mobile-responsive design with proper axis labeling, data value display on all chart elements, and touch-friendly interaction patterns
- Integrated news source analysis comparing hiring data patterns with Reality Labs financial reports, market performance, and strategic announcements
Full interactive analysis: https://storage.googleapis.com/meta-vr-ar-analysis-2025/index.html
Posted by aaghashm
6 Comments
> Filtered to include VR/AR-specific roles using AI analysis of job titles and descriptions (Reality Labs, spatial computing, computer vision, haptics, Quest, Oculus, metaverse, immersive experiences keywords)
??? Dear LLM, does this job post contain following keywords? Or what do you mean by AI here?
aware hard-to-find makeshift flowery price different wine tender march cable
*This post was mass deleted and anonymized with [Redact](https://redact.dev/home)*
This is incredibly detailed analysis – the $5.6B annual investment figure really puts Meta’s AR/VR commitment in perspective.
What strikes me most is the 74% concentration at L4-L5 levels. That suggests they’re not just hiring fresh grads but targeting experienced professionals who can hit the ground running.
The geographic distribution is smart too – diversifying beyond the Bay Area reduces talent competition and costs. Given the Reality Labs losses, this hiring blitz feels like doubling down on the metaverse bet. Do you think this hiring pace is sustainable if they don’t see revenue traction soon?
I am surprised that they are doubling down on vr/ar, given the tepid reception of this in the marketplace.
By the way, did you run spot checks on the automated filtering of job ads? These numbers seem high to me even if they are continuing to work in the vr/ar space.
where are they possibly hiring L4-L5 VR devs from? no one else is dumping billions into this per year
How (or to what extent) does this account for ghost jobs?