Share Facebook Twitter LinkedIn Pinterest Bluesky Threads Toyota Corolla 1.5 VVT-i. Average speed with stops included. Posted by gropula
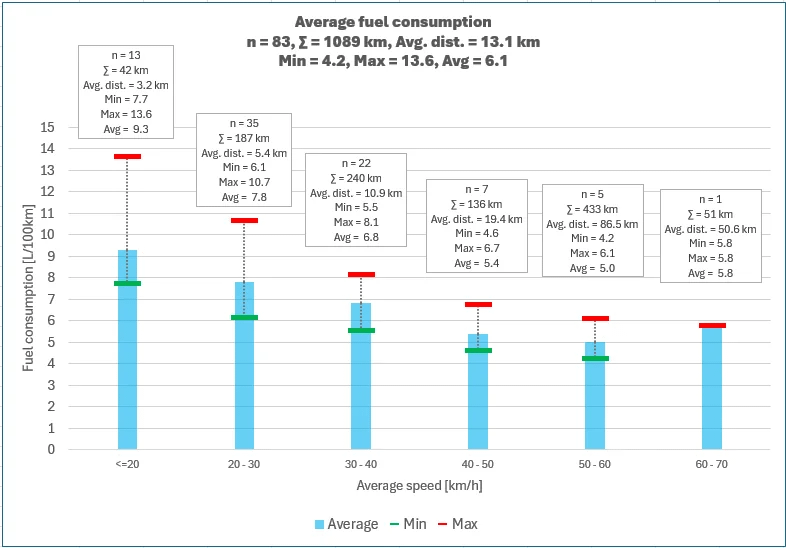
Brighter_rocks on September 6, 2025 10:19 am Looks like the classic “city vs highway” story but visualized really cleanly. – <20 km/h is brutal (9.3 L/100 km avg), basically stop-and-go traffic. – The sweet spot is clearly 50–60 km/h, dropping to ~5 L/100 km. -After that, the one lonely datapoint at 60–70 km/h shows it creeping back up a bit. Cool to see the data match the intuition: congestion kills efficiency, steady mid-speed cruising wins.

1 Comment
Looks like the classic “city vs highway” story but visualized really cleanly.
– <20 km/h is brutal (9.3 L/100 km avg), basically stop-and-go traffic.
– The sweet spot is clearly 50–60 km/h, dropping to ~5 L/100 km.
-After that, the one lonely datapoint at 60–70 km/h shows it creeping back up a bit.
Cool to see the data match the intuition: congestion kills efficiency, steady mid-speed cruising wins.