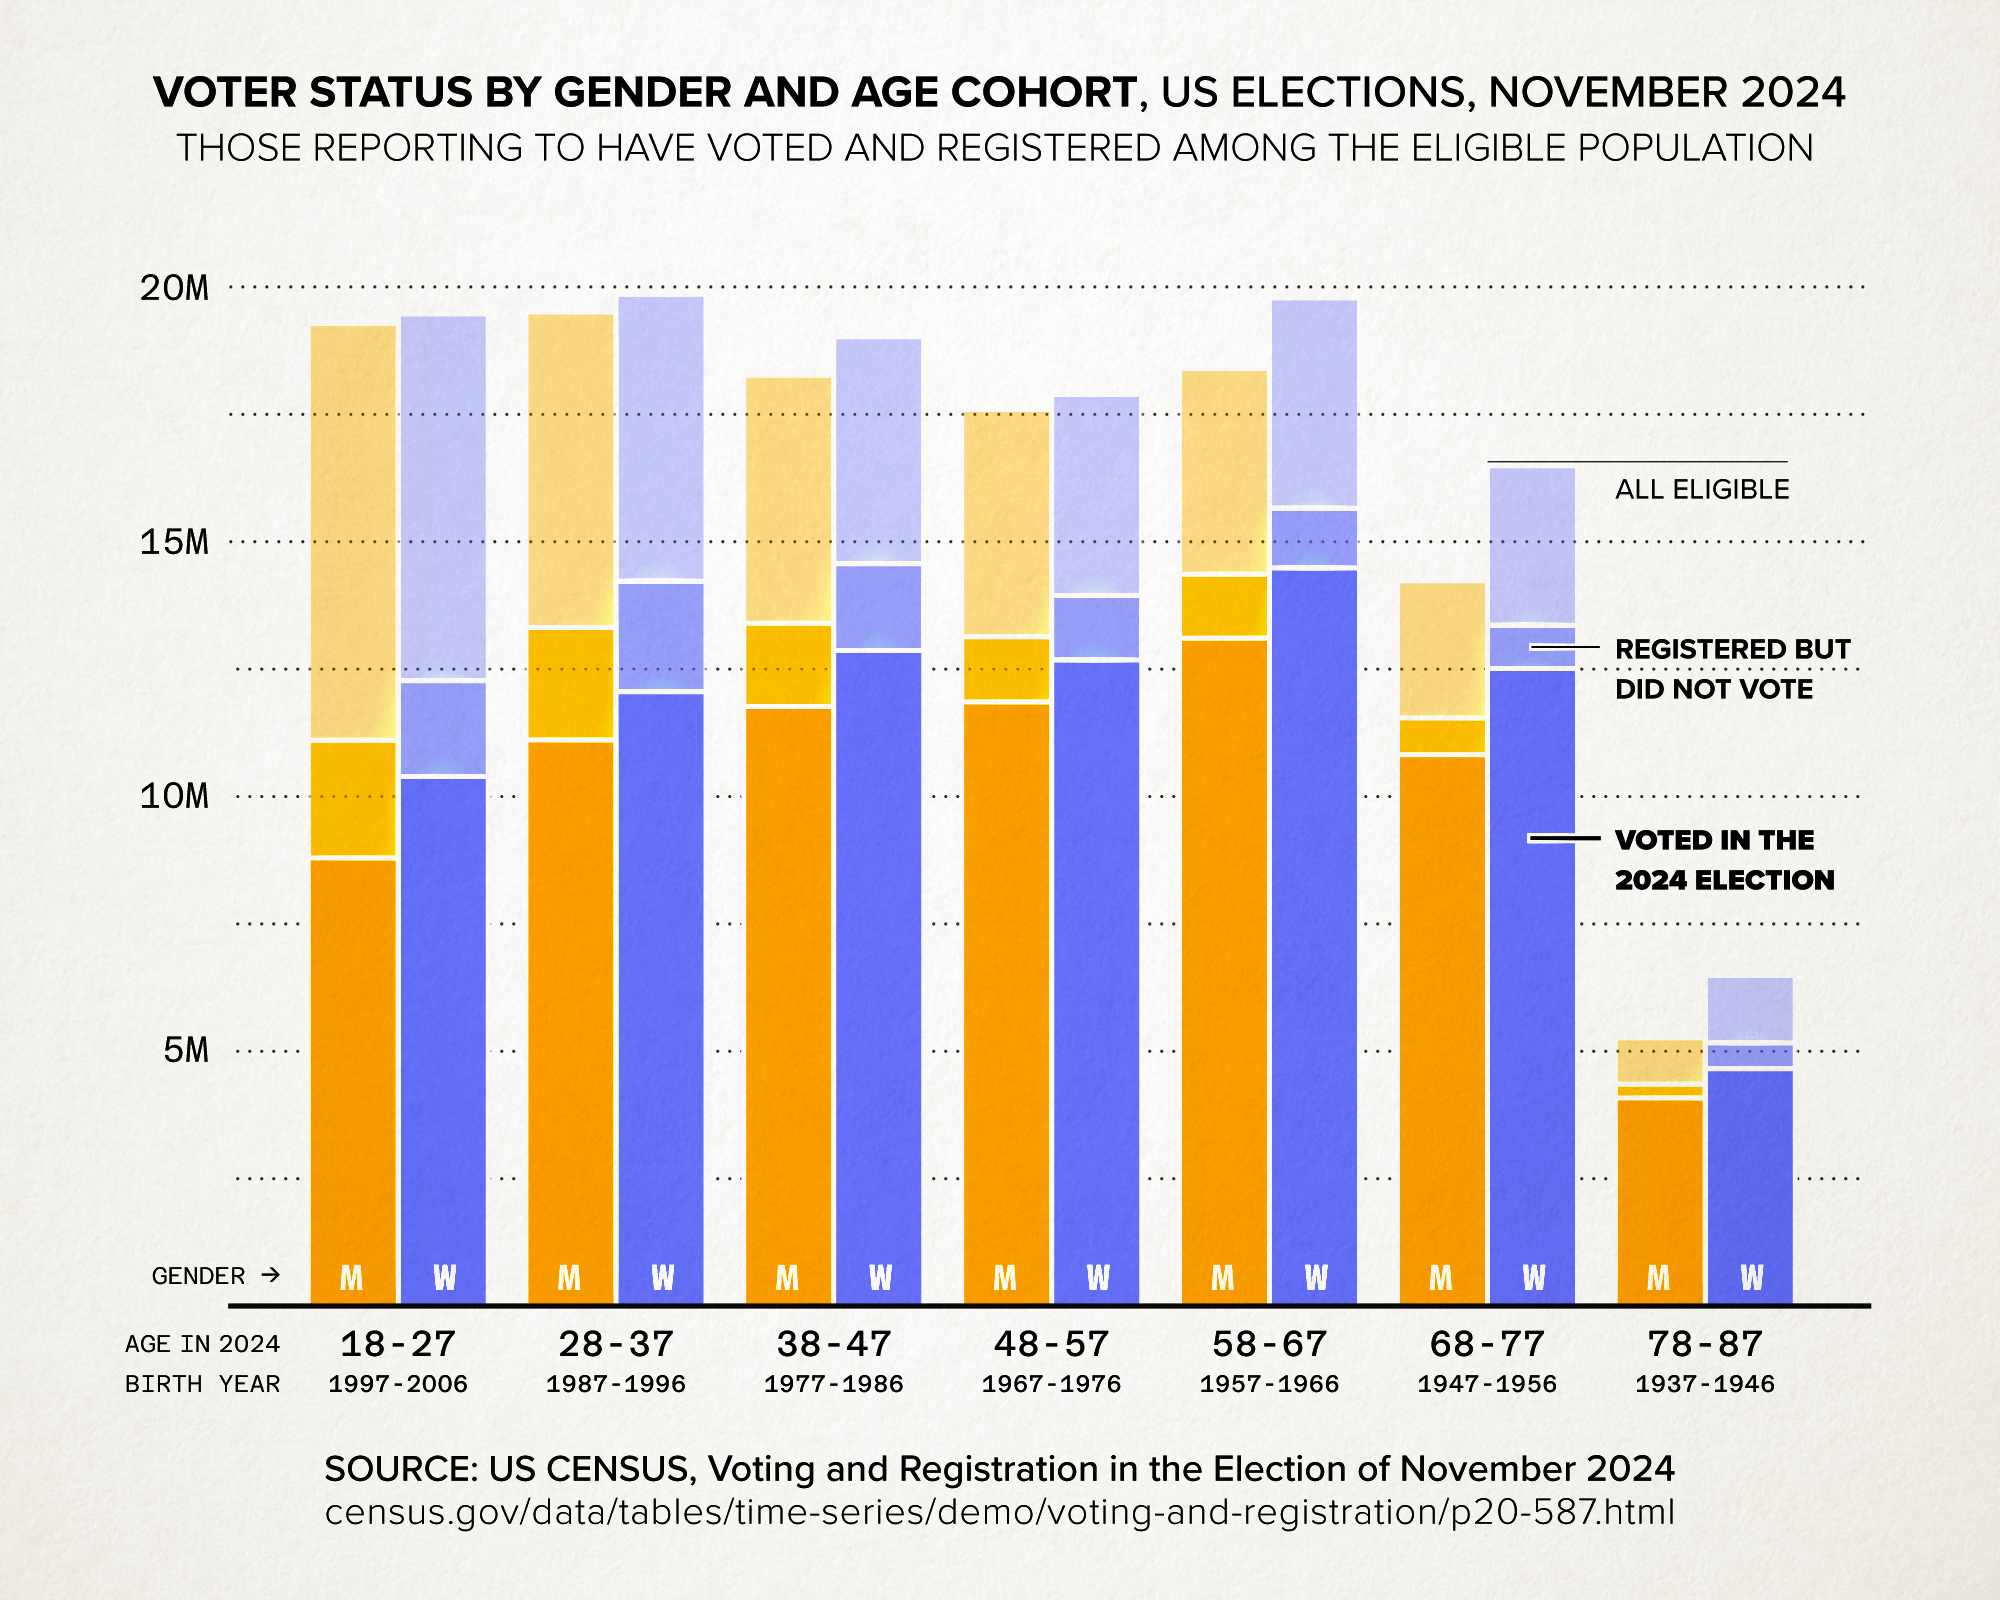
[OC] Voter Participation by Gender and Age Cohort, US National Elections, 2024 v.2*
US Census Data: Voting and Registration in the Election of November 2024. Table 1: Reported Voting and Registration, by Sex and Single Years of Age.
Each group of bars is a ten-year cohort per age. Men are in orange and women are in purple. The stack height is the total eligible population, and this is broken down into those who reported that they voted (darkest segment), those who reported that they registered but did not vote (middle segment), and the remainder.
The data table was explored and organized in macOS Numbers, then plotted into ten-year cohorts, grouped by gender, and stacked according to reported voting status (as a percentage of the total eligible). Employed R with ggplot, then added annotations and embellishment in Adobe Illustrator.
* Note: A prior post of this chart miscalculated the values for the eldest cohort (born 1937-1946). This has been corrected.

![[OC] Voter Participation by Gender and Age Cohort, US National Elections, 2024 v.2](https://www.byteseu.com/wp-content/uploads/2025/09/mr3v8q73qkof1-1536x1229.png "[OC] Voter Participation by Gender and Age Cohort, US National Elections, 2024 v.2")
7 Comments
[OC] Voter Participation by Gender and Age Cohort, US National Elections, 2024 v.2*
US Census Data: Voting and Registration in the Election of November 2024. Table 1: Reported Voting and Registration, by Sex and Single Years of Age.
Each group of bars is a ten-year cohort per age. Men are in orange and women are in purple. The stack height is the total eligible population, and this is broken down into those who reported that they voted (darkest segment), those who reported that they registered but did not vote (middle segment), and the remainder.
The data table was explored and organized in macOS Numbers, then plotted into ten-year cohorts, grouped by gender, and stacked according to reported voting status (as a percentage of the total eligible). Employed R with ggplot, then added annotations and embellishment in Adobe Illustrator.
* Note: A prior post of this chart miscalculated the values for the eldest cohort (born 1937-1946). This has been corrected.
Data source:
Voting and Registration in the Election of November 2024,
Table 1: Reported Voting and Registration, by Sex and Single Years of Age
https://www.census.gov/data/tables/time-series/demo/voting-and-registration/p20-587.html
Data gist (in thousands):
|Cohort |Gender|Eligible|Voted|Regd_minus_Voted|Remainder|
|———|——|——–|—–|—————-|———|
|1997–2006|Man |19280 |8793 |2310 |8177 |
|1997–2006|Woman |19471 |10394|1879 |7198 |
|1987–1996|Man |19508 |11110|2207 |6191 |
|1987–1996|Woman |19855 |12058|2166 |5631 |
|1977–1986|Man |18268 |11766|1632 |4870 |
|1977–1986|Woman |19024 |12865|1705 |4454 |
|1967–1976|Man |17596 |11856|1277 |4463 |
|1967–1976|Woman |17889 |12679|1265 |3945 |
|1957–1966|Man |18397 |13107|1256 |4034 |
|1957–1966|Woman |19784 |14482|1173 |4129 |
|1947–1956|Man |14232 |10822|717 |2693 |
|1947–1956|Woman |16492 |12510|853 |3129 |
|1937–1946|Man |5266 |4085 |268 |913 |
|1937–1946|Woman |6490 |4660 |502 |1328 |
What’s the top bar? Voted but not registered? Not registered but voted?
Nothing will make you feel older than seeing the voter turnout rates of people younger than you, good grief.
Pretty impressive by the 78-87 group.
At that age, if I make it, I am not sure I’d go to a polling station if mail voting is not available
This is a very neat graph. Although splitting male and female doesn’t add much and makes the differences between age groups harder to interpret.
Damn. Americans really just start dropping off at 78.
I’ve never missed an election since I was 18. Quite sad to see that the younger cohort has all the potential voting power, but it’s wasted.