Data: NAEP Report Card: Mathematics https://www.nationsreportcard.gov/mathematics/states/achievement/?grade=8
Tool: Mapchart https://www.mapchart.net/usa.html
Posted by snakkerdudaniel

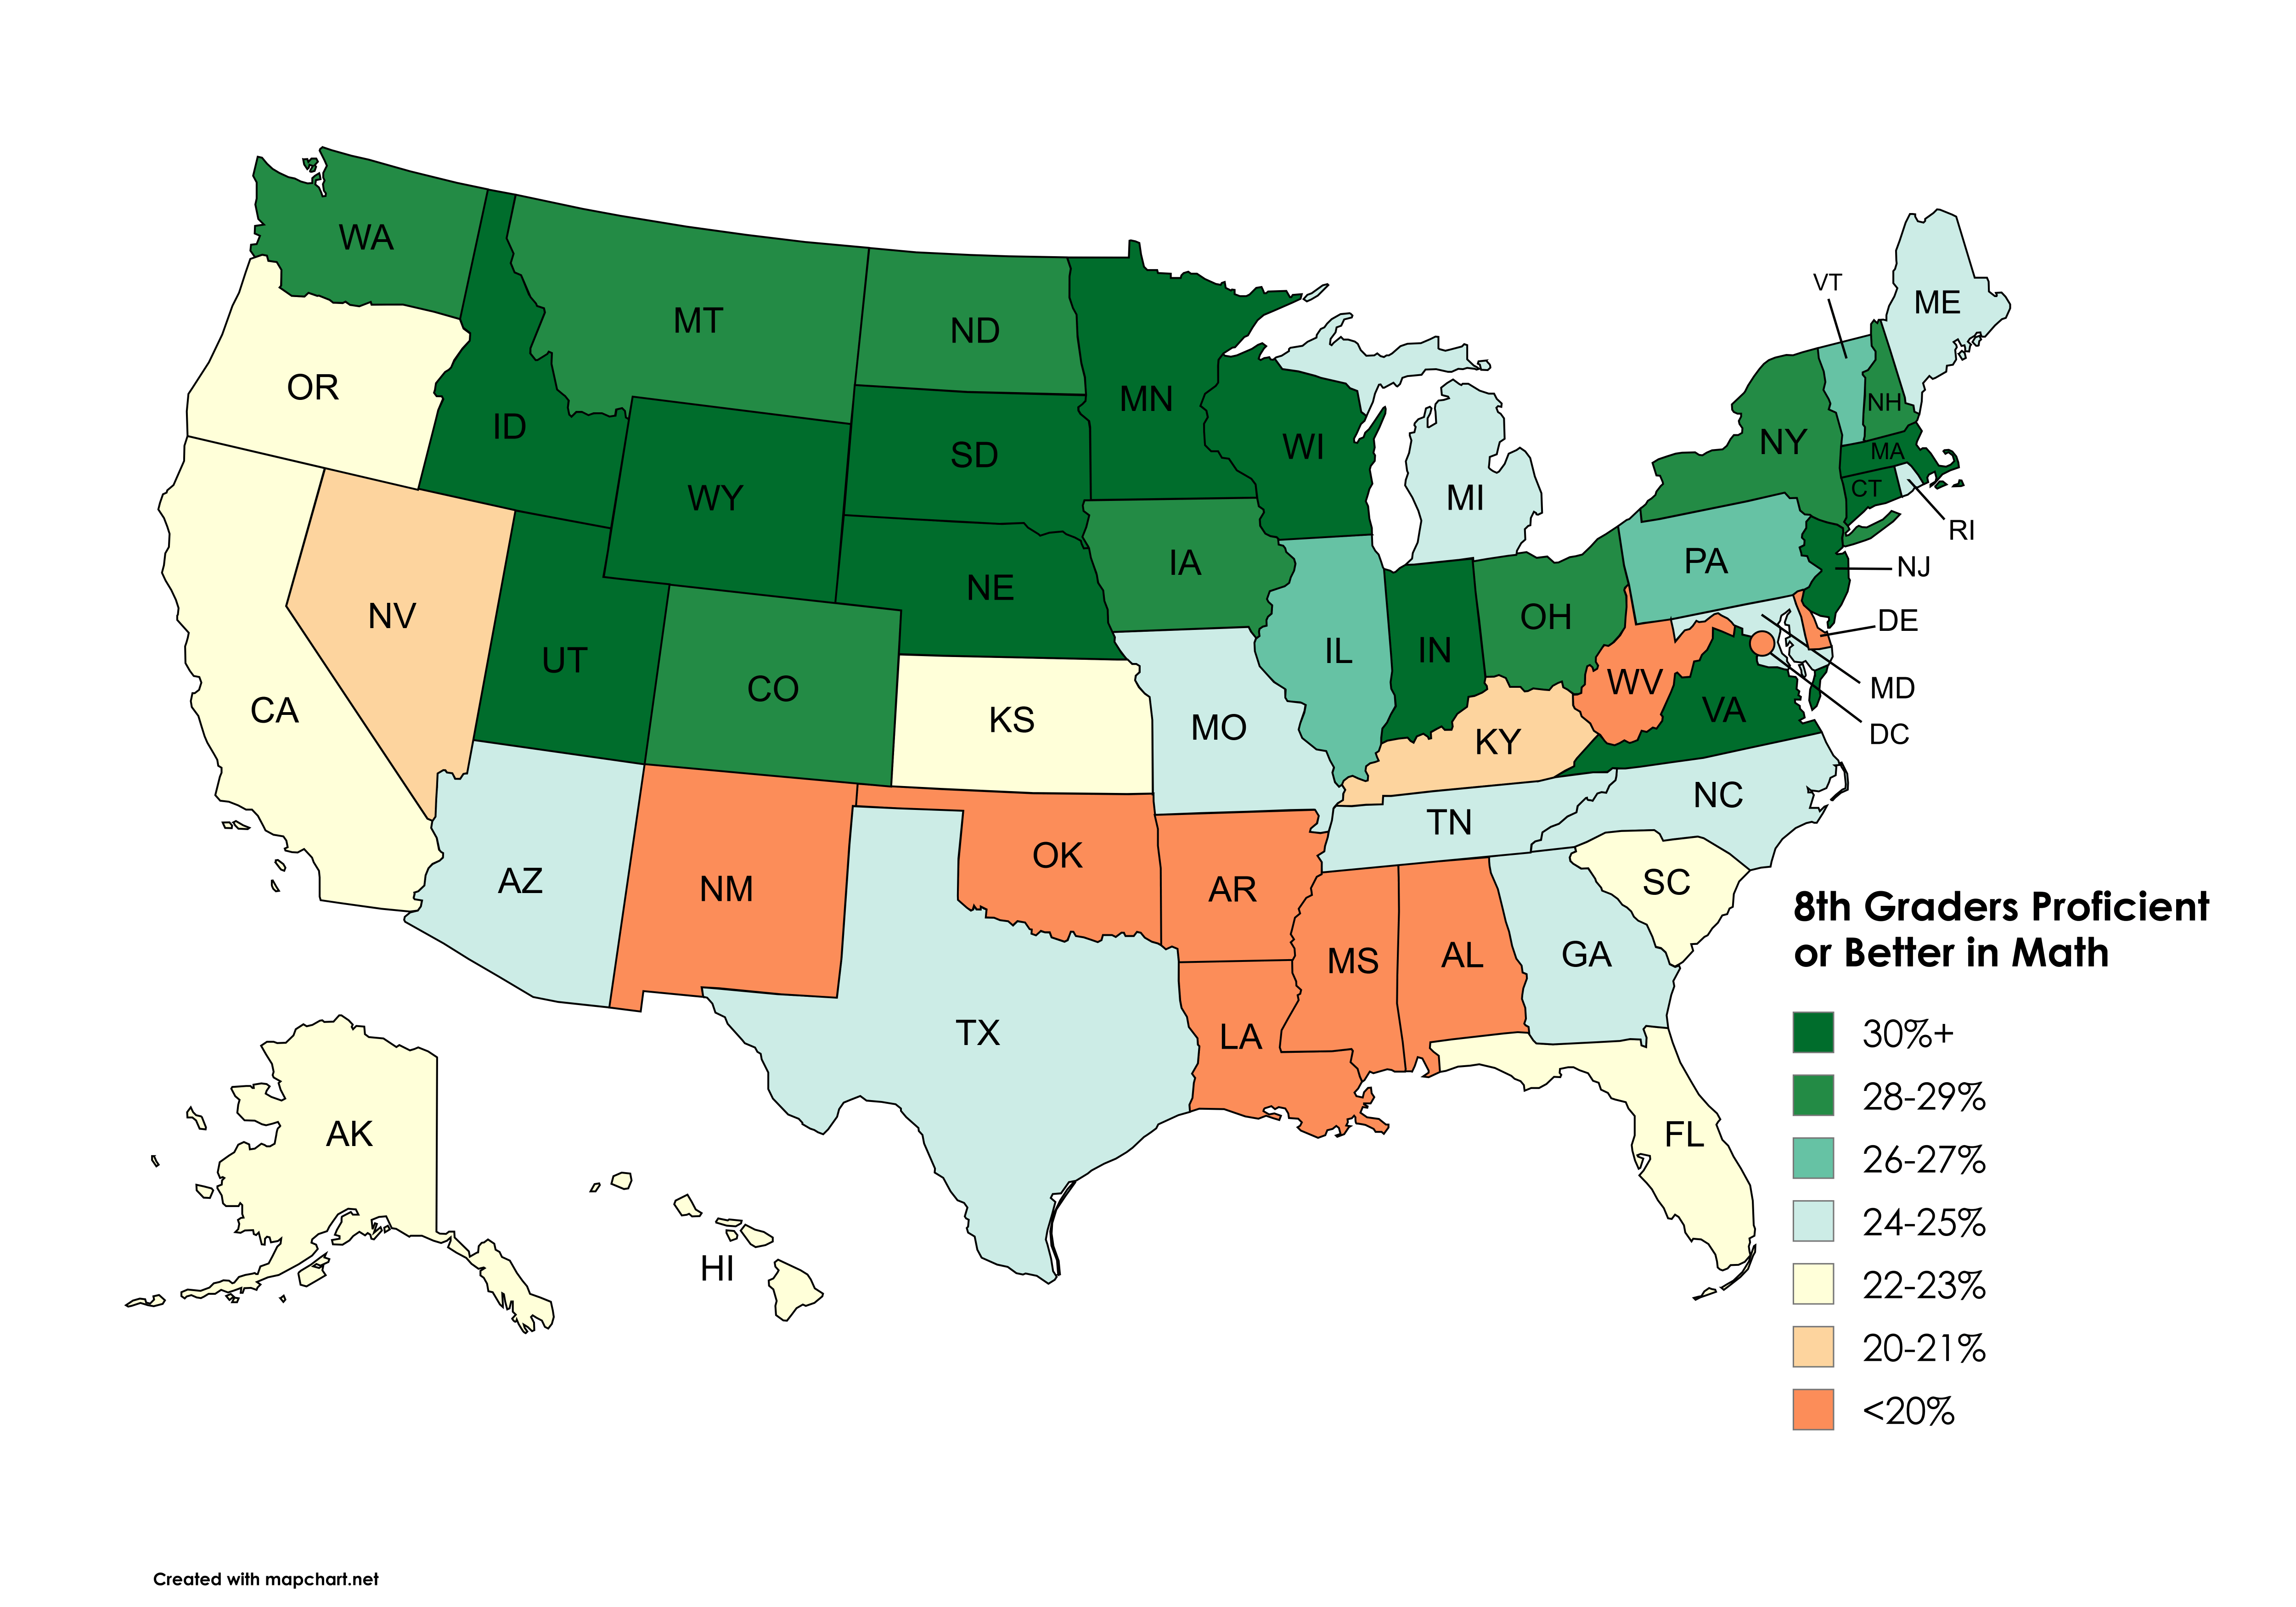
![[OC] Percent of 8th Graders Proficient or Better in Math by US State in 2022](https://www.byteseu.com/wp-content/uploads/2025/09/3bmo56m4cmpf1-1536x1075.png "[OC] Percent of 8th Graders Proficient or Better in Math by US State in 2022")
Data: NAEP Report Card: Mathematics https://www.nationsreportcard.gov/mathematics/states/achievement/?grade=8
Tool: Mapchart https://www.mapchart.net/usa.html
Posted by snakkerdudaniel
35 Comments
Well they do have higher latitude numbers.
20% does not seem that different from 30% in the grand scheme of things. Two in ten kids being good at math is bad, shameful. Three in ten? That’s dark green, fellow winners
How has this changed with time? It looks terrible, but what are these numbers historically?
Oh hello there Mississippi/Alabama
Is this an all time high? An all time low? Data without context is nearly meaningless…
30% is the highest bracket? This is beyond insane.
How much above 30% and below 20% does the data go? This could be lumping together states that differ by more than the entire color range does.
That a mere 3/10 of your next generation being proficient in basic middle school math merits a shade of green typically reserved for resounding success is an indictment of the American education system.
What does Proficient or Better in Math mean? better than who? Proficient in what sense?
The link you added gives more context however, I can’t find how is the test conducted? Do they give standardized tests to each student in the country? Depend on state’s test? How is the scores weighted? If they are using the state’s test is the difficulty of each state’s test taken into account?
Just a bit confused over the data collection.
Oregon really ? Step it up please.
Alarming. I wonder about literacy.
All this shows is that snow makes people smarter at math.
Midwestern kids math hard.
For some context apparently in 2022 Korea had %58 students proficient.
Just as an aside – Mississippi has made substantial improvements in reading in recent years
30% is the best bracket? xD
Delaware being in the lowest category honestly surprises me. I’ve never been there but I always had the impression that Delaware is a state that mostly has its act together and that rough spots like Wilmington were just outliers.
Looking at these maps, I feel bad for Texas being surrounded by whatever the fuck is happening in those neighboring states
I’m actually amazed AZ isn’t in orange.
ahahahah whole thing should be fucking red. 30% is abysmal
Is this once you graduate or in general, because I’ve forgotten so much math I’m below whatever grade they teach algebra now. Use it or lose it 🤪
Ok so a lot of overreaction to this it seems because classic reddit moment, nobody looked into the definitions of what any of this means. Excerpt below is how NAEP Proficient is defined for the 8th grade level:
Students performing at the NAEP Proficient achievement level can likely
demonstrate an understanding of using and creating ratios to solve problems mathematically or in context
calculate GCF and LCM
perform basic operations with rational numbers to solve problems in context while applying proper units and converting between fractions, decimals, and percent
compare and order rational numbers with rational or common irrational numbers with or without a number line
apply problem-solving strategies to solve square roots and ratio and proportions
Students performing at the NAEP Proficient achievement level can likely
demonstrate an understanding of solving problems that relate to comparing measures of two or three dimensions of space
determining possible dimensions given area and volume as well as selecting appropriate units of measure and applying scale factor to area
reason abstractly using addition and subtraction in contextual situations
solve problems involving capacity, area, and weight
classify angle measurements using diagrams and protractors
Students performing at the NAEP Proficient achievement level can likely
understand concepts of parallel and perpendicular lines
use angle relationships and/or measurements formed when parallel lines are cut by a transversal.
apply concepts of corresponding parts between similar and congruent figures with some containing composite shapes in context
apply problem-solving strategies to solve Pythagorean Theorem problems
solve problems in context by creating a figure in the coordinate plane that satisfies area and perimeter criteria
reflect a shape on the coordinate plane over the x- and y-axis and plot some of the corresponding points
determine unknown side lengths by decomposing a polygon using given constraints
determine coordinates of missing endpoints of vertical or horizontal line segments on a coordinate plane
Students performing at the NAEP Proficient achievement level can likely
use problem solving skills to make calculations based on multiple representations of data sets in context to determine measures of central tendencies, theoretical probability, and basic probability concepts
estimate values along the line of best fit
identify sources of bias in a sample design
calculate the mean from tables of data in multiple sets of values
Students performing at the NAEP Proficient achievement level can likely
create, model, identify, and solve one-step inequalities and multi-step equations with or without context and with or without constraints
evaluate and extend sequential and recursive patterns using tables, models, multiple steps or from translating a written description
graph and identify key features of linear and nonlinear functions
recognize the effects on a graph when the slope and y-intercept are changed
This would make a lot more sense by county.
If any of you try and teach math, or a teacher of anything tbh, you’ll understand.
What’s going on in Delaware and DC?
https://www.nationsreportcard.gov/mathematics/sample-questions/?grade=8
The definition of “Proficient” in the NEAP is “Students demonstrate solid academic performance and competency over challenging subject matter.” The goal of the NEAP is to help compare performance in different schools, but it was never the intent that 100% of students would be at this level.
I found this website super helpful to get some context for what this actually means in a practical way. It breaks down specific topics, along with percentage correct on those topics. It seems to show that most 8th graders can do basic math – arithmentic, distances, areas, rational numbers, etc. But some of the problems are fairly difficult or tricky. About 20% of 8th graders are able to excel, solving even the hard problems.
30% in above is a pretty low bar.
That actually kind of surprises me. I didn’t think Minnesota would be as bad as the south. But I didn’t expect a score this good.
Related: I spent about 10 months in Utah a few years back, and the kids there are WAY ahead the of the majority of what I’ve seen here. Our shop lead had a daughter in sixth grade at the time and her math homework was harder than anything I had in eighth grade.
As a MS teacher, I always wonder how accurate these tests are.
Our kids KNOW these tests do not mean anything to them personally. It has no grade bearing, and nothing to do with advancement or placement.
In my experience, our highest performing students give the LEAST amount of effort on these because they really know it does not have bearing on them personally.
I’m pleading with you to learn the difference between divergent color scales and single-hue scales and why you should choose one or the other. Please, I’m begging.
From WV, can confirm I suck at math.
Canada is a positive influence on US math?
Most children left behind, apparently.
Whenever Michigan is an outlier in any map like this, the answer is always Detroit
Just what I always suspected. You can’t learn math if you’re sweating balls.