
![[OC] Total ANKC Registration Trends per year vs. Over-all puppies for sale queries per year.](https://www.byteseu.com/wp-content/uploads/2025/09/ad8rq7vl1ppf1-1024x338.png "[OC] Total ANKC Registration Trends per year vs. Over-all puppies for sale queries per year.")
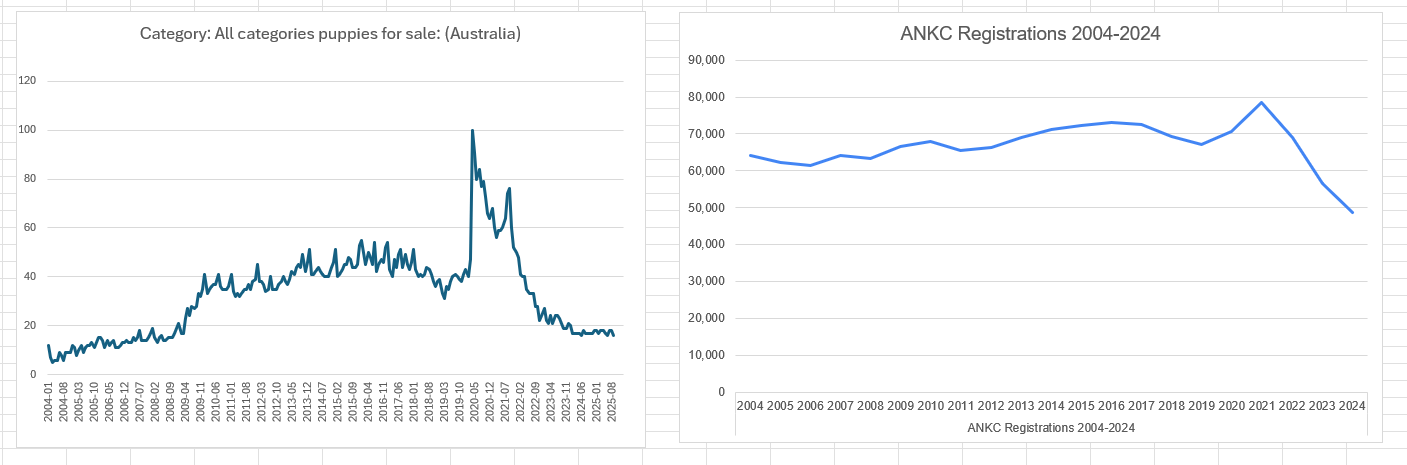
Currently trying to compile data in an effort to understand the full picture of the dog demographic populations in Australia. I've been compiling data on Excel and made these two charts and found the output astounding.
There is a lot of talk from rescues regarding an "overpopulation" of dogs. ANKC Data (2000-2009 https://dogsaustralia.org.au/media/9572/rego-stats-list_2000-2009.pdf, 2010-2021 https://dogsaustralia.org.au/media/9822/rego-stats-list_2010-2021.pdf, 2018-2024 https://dogsaustralia.org.au/media/10305/rego-stats-list_2018-2024.pdf ) All indicate that the ANKC population has gone DOWN in recent years, not up. I was really interested to see what the non-ANKC/over-all dog population would indicate, because I'm really on the fence about the idea that there's an overpopulation of dogs, I've been theorizing that there's a supply-side issue for homes where homes that historically would be going out and buying puppies, or keeping their adult dogs for life, are no longer able to… not that there's inherently more dogs now than ever before.
Google Trends for the search term "puppies for sale" ( https://trends.google.com/trends/explore?date=all&geo=AU&q=puppies%20for%20sale ) seems to follow an almost the exact *same* pattern, which is *really* *really* useful for my analysis. Figured at least one other person here may appreciate this.
Posted by Tauralus
1 Comment
would be interesting to see, if its global pattern or not