
![Growth in Human Development Index (HDI) from 2010-2023 for the world's top 15 economies [OC]](https://www.byteseu.com/wp-content/uploads/2025/09/zbtfztrhjsqf1-1024x583.png "Growth in Human Development Index (HDI) from 2010-2023 for the world’s top 15 economies [OC]")
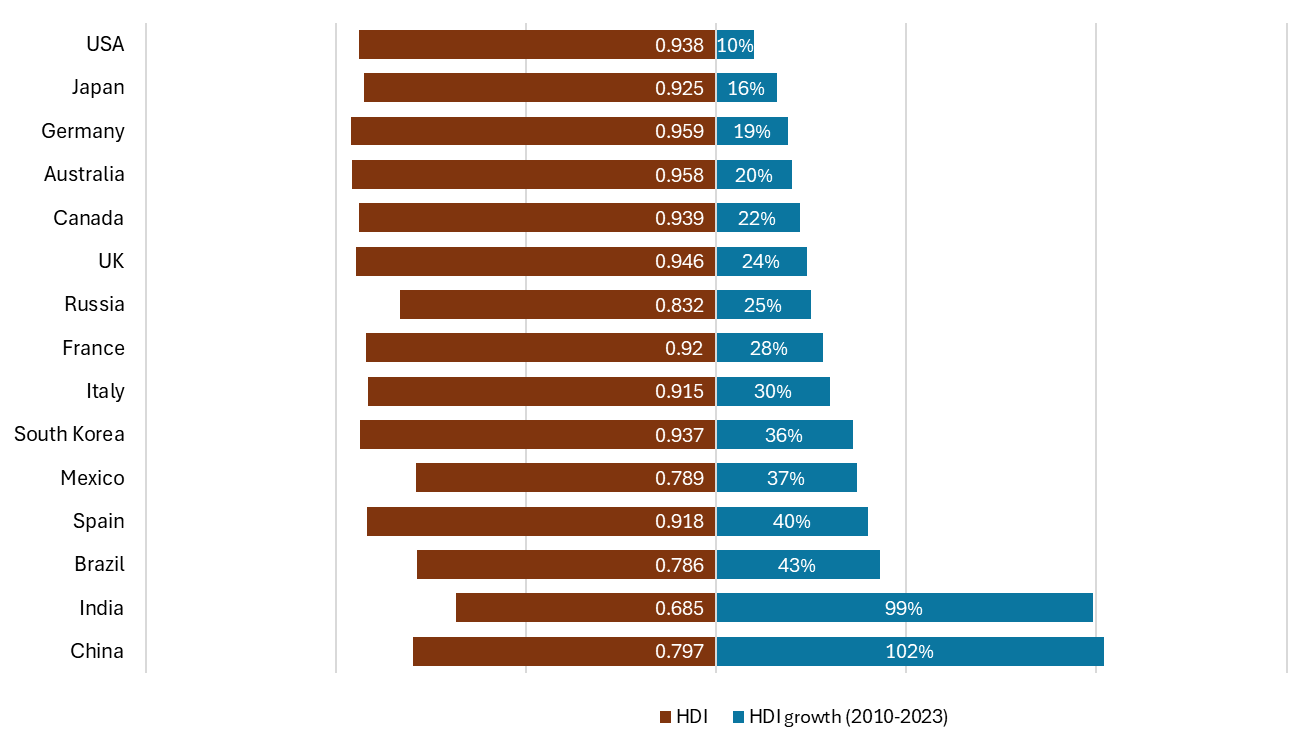
Made in Excel. All data is from Wikipedia. Economy size based on GDP. HDI data is from their 2025 report, which is based on data collected in 2023.
From Wikipedia as well:
The Human Development Index (HDI) is a statistical composite index of life expectancy, education (mean years of schooling completed and expected years of schooling upon entering the education system), and per capita income indicators, which is used to rank countries into four tiers of human development.
Posted by wayne_simien_2020MVP
5 Comments
Data source is Wikipedia. Tool is Excel.
Al that growth and they still can’t be at the top. The battle of the disabled
1. This is not a great visualization to convey what you’re trying to display.
2. These figures are not presented correctly either. Check the source again.
This is a bad way to plot them.
Try just doing a normal stacked bar chart. That will communicate the difference well.
OP do you mind to delete this post? It clearly has incorrect data. I understand it was a mistake but it’s better to not share incorrect visualizations