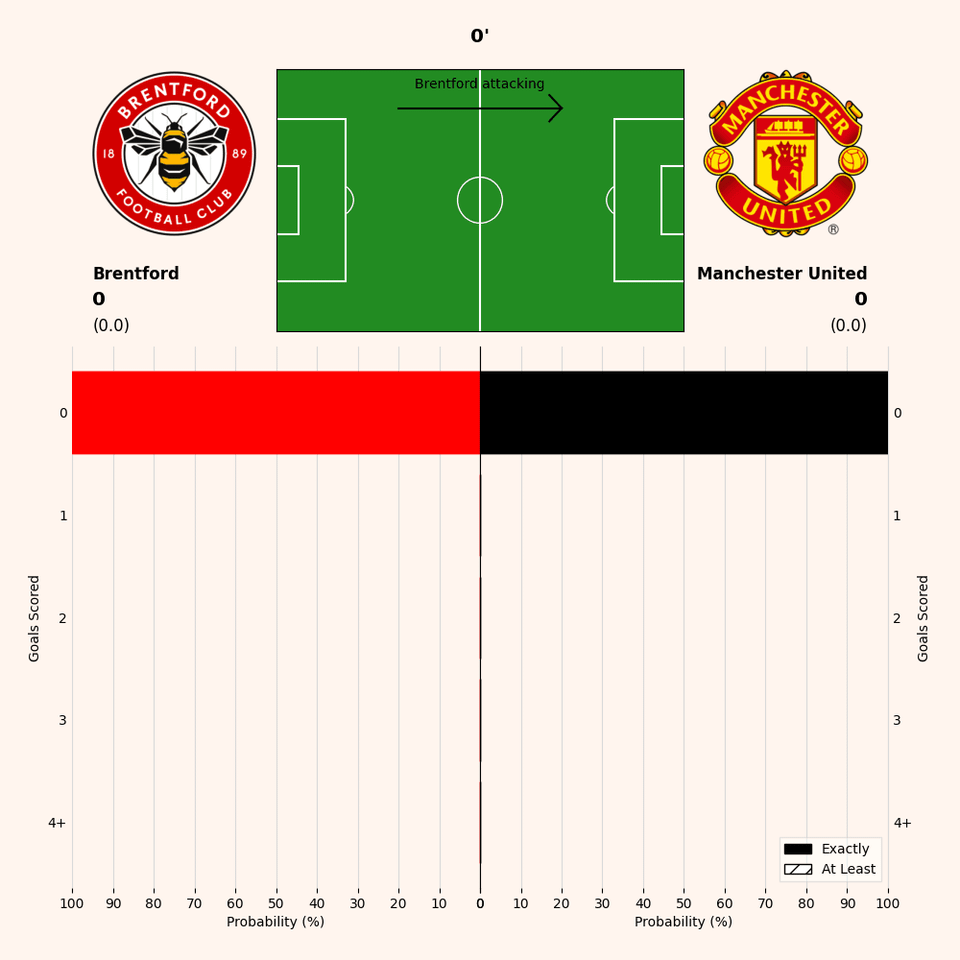
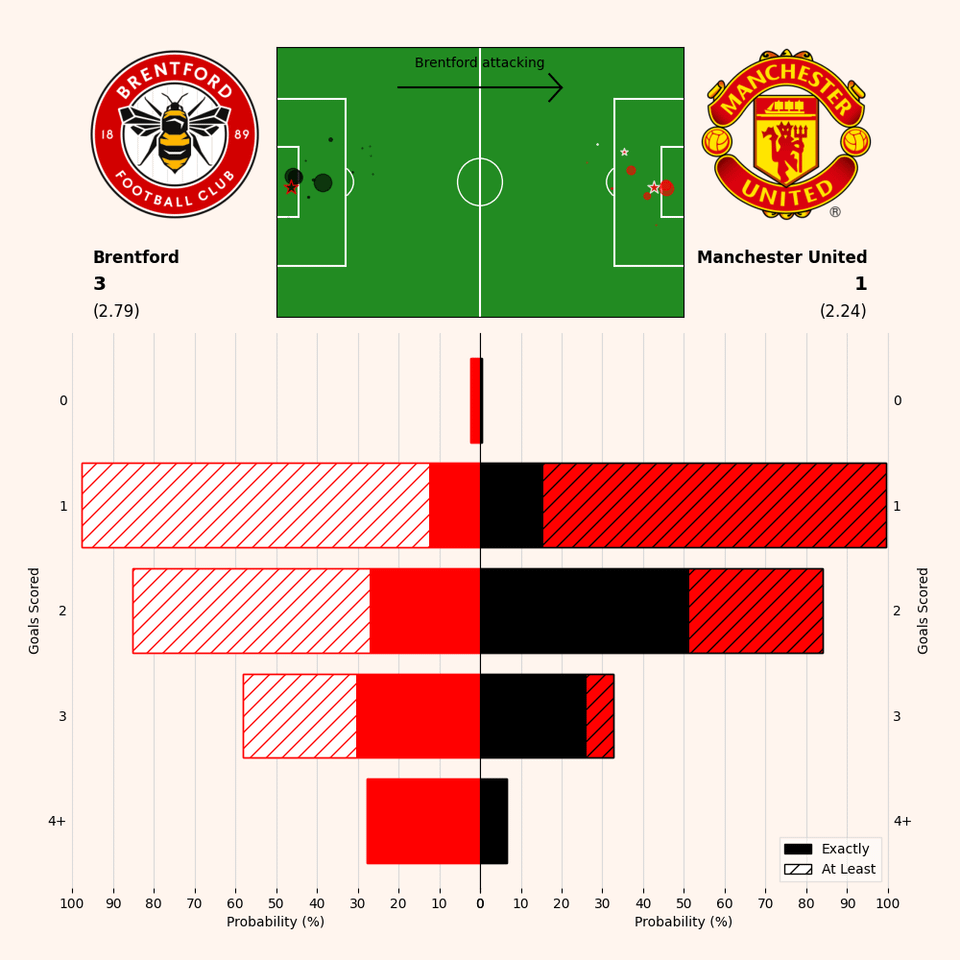
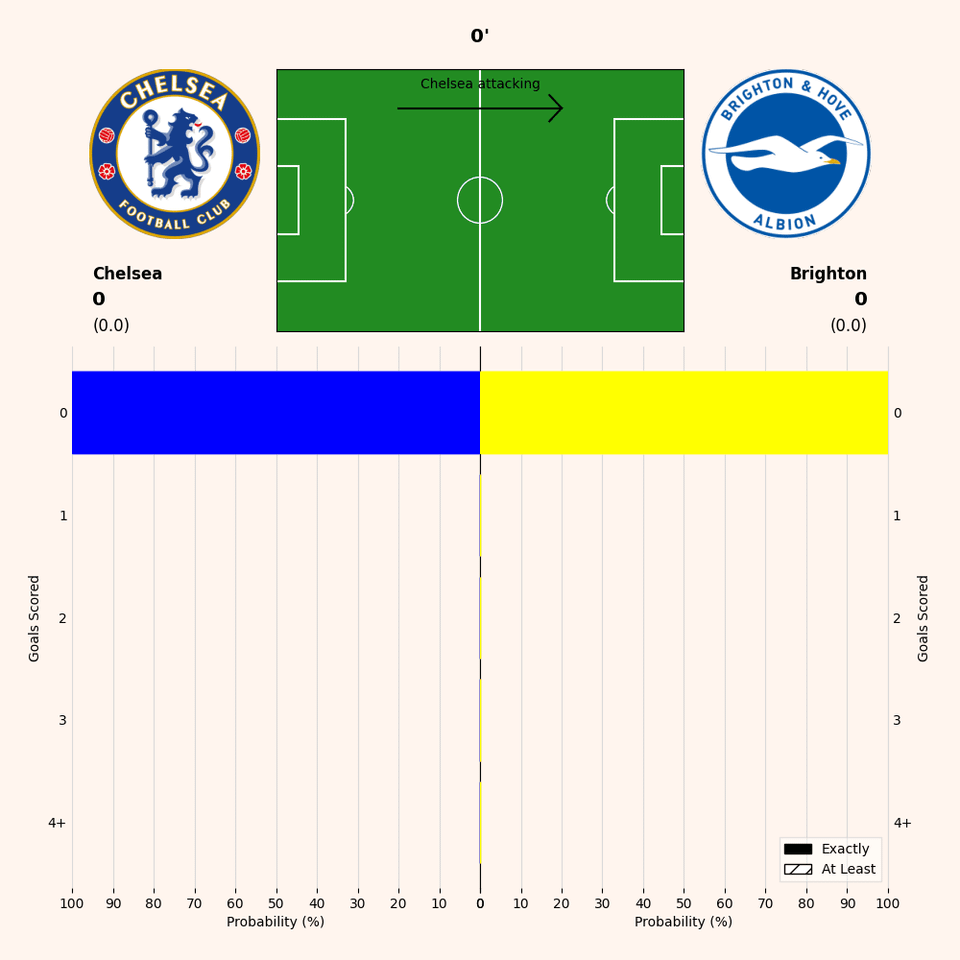
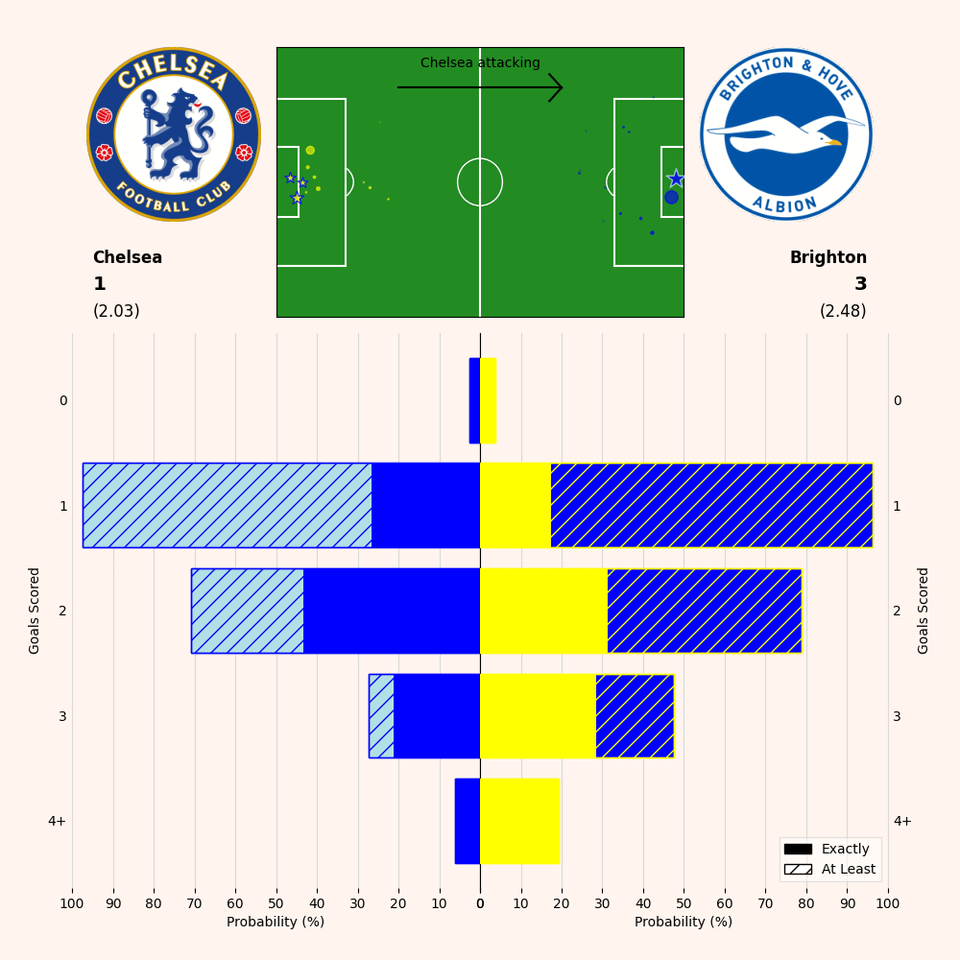
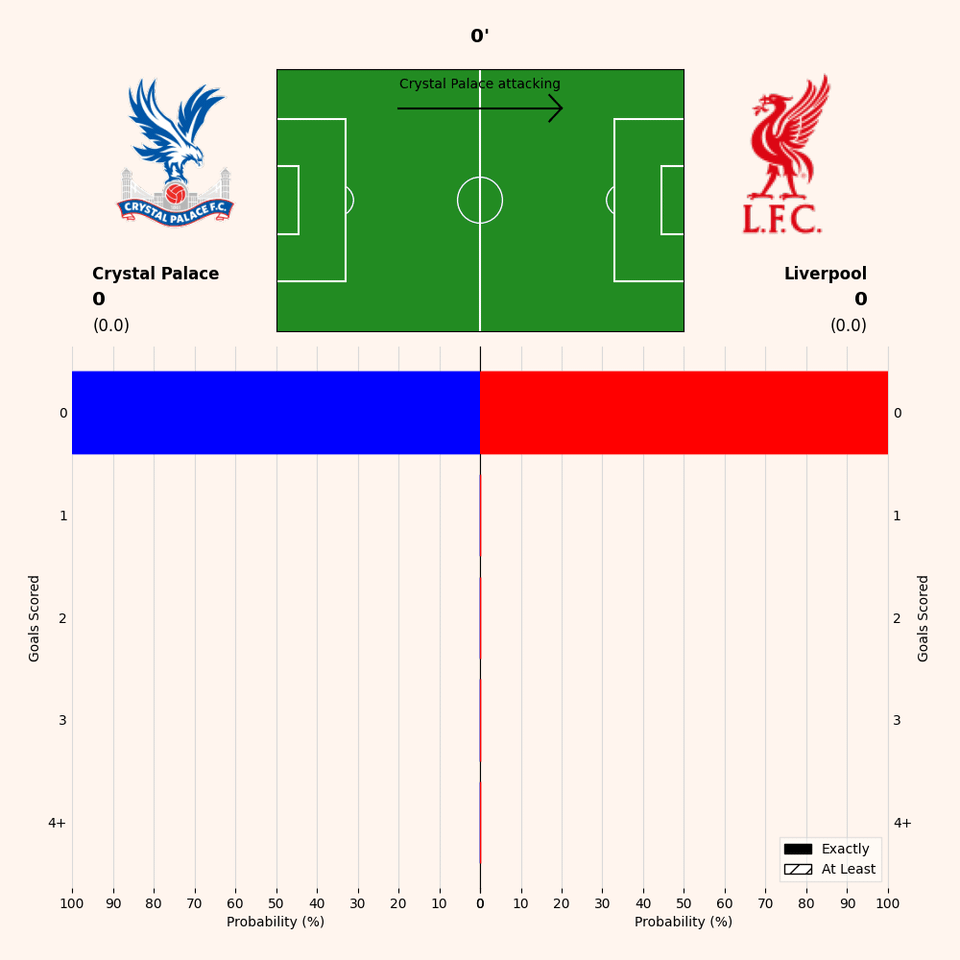
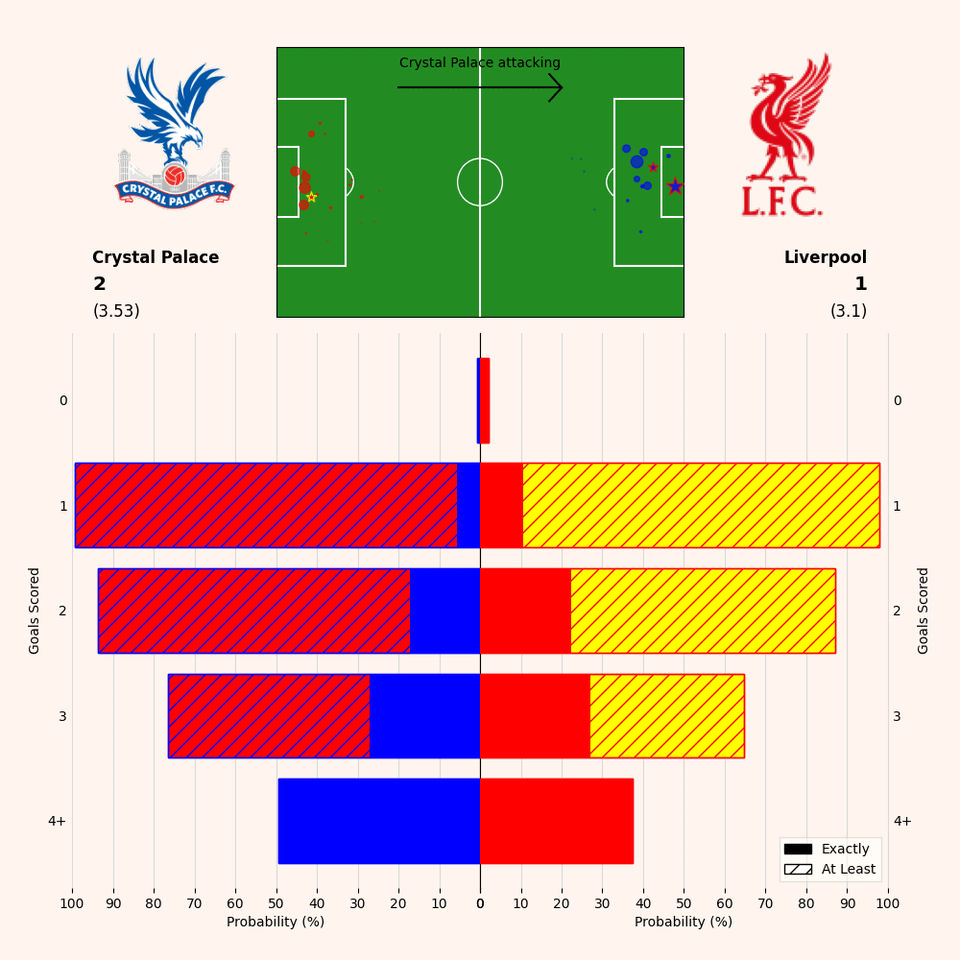
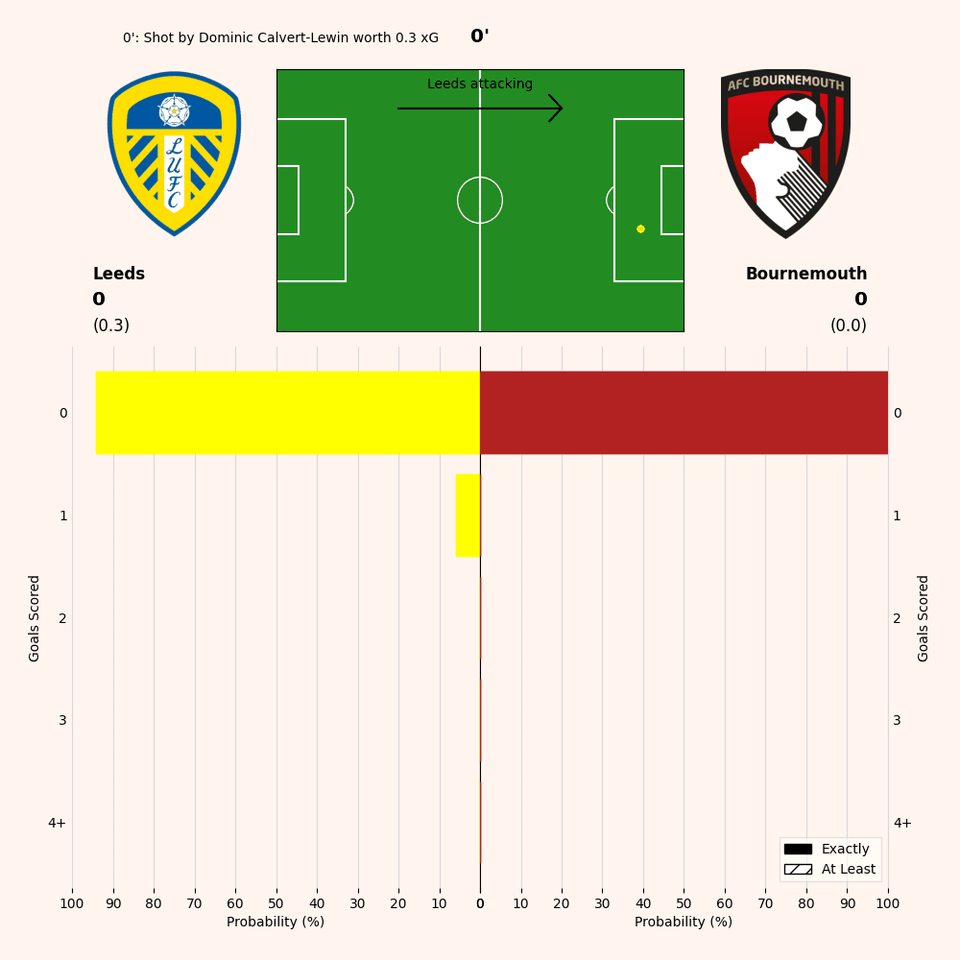
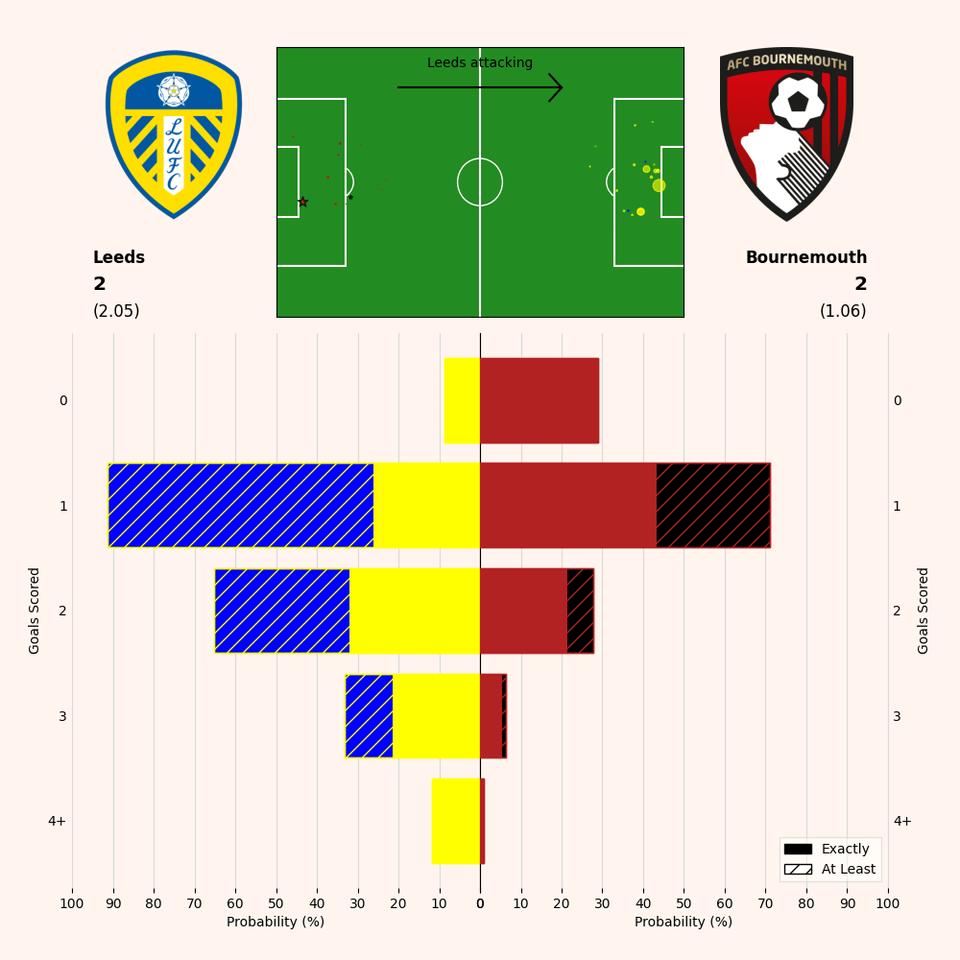
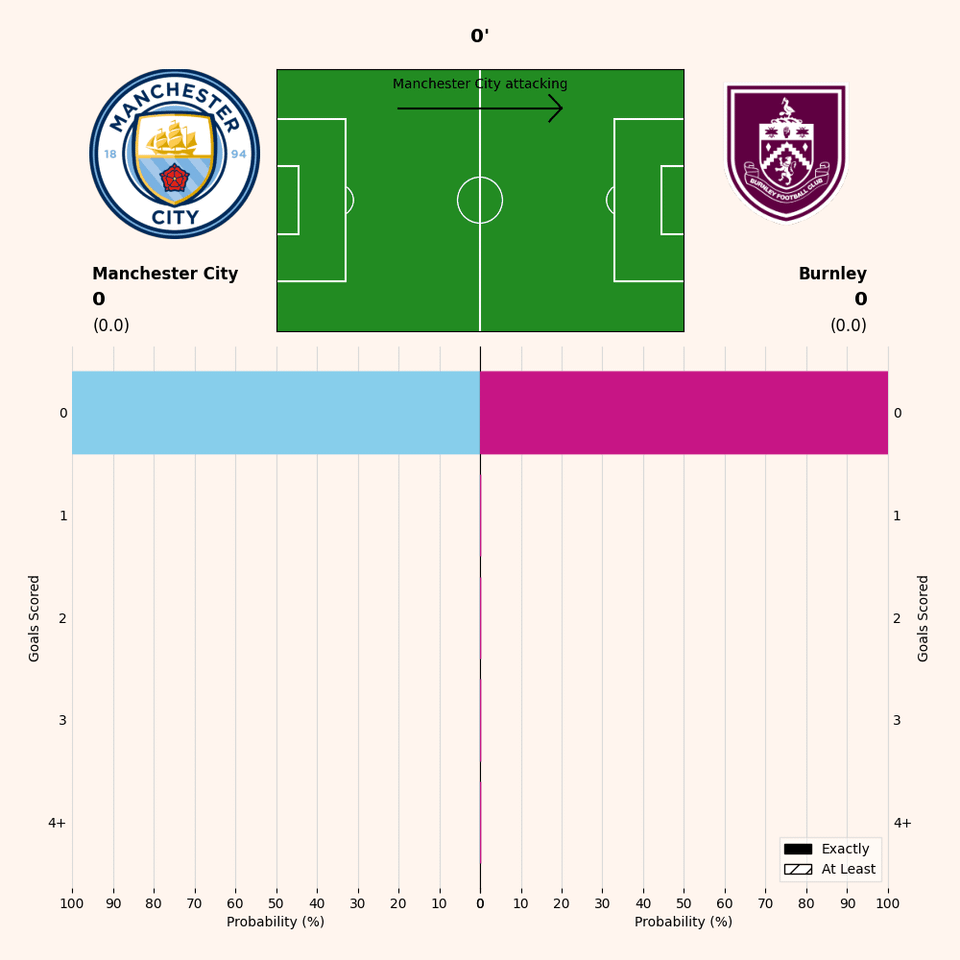
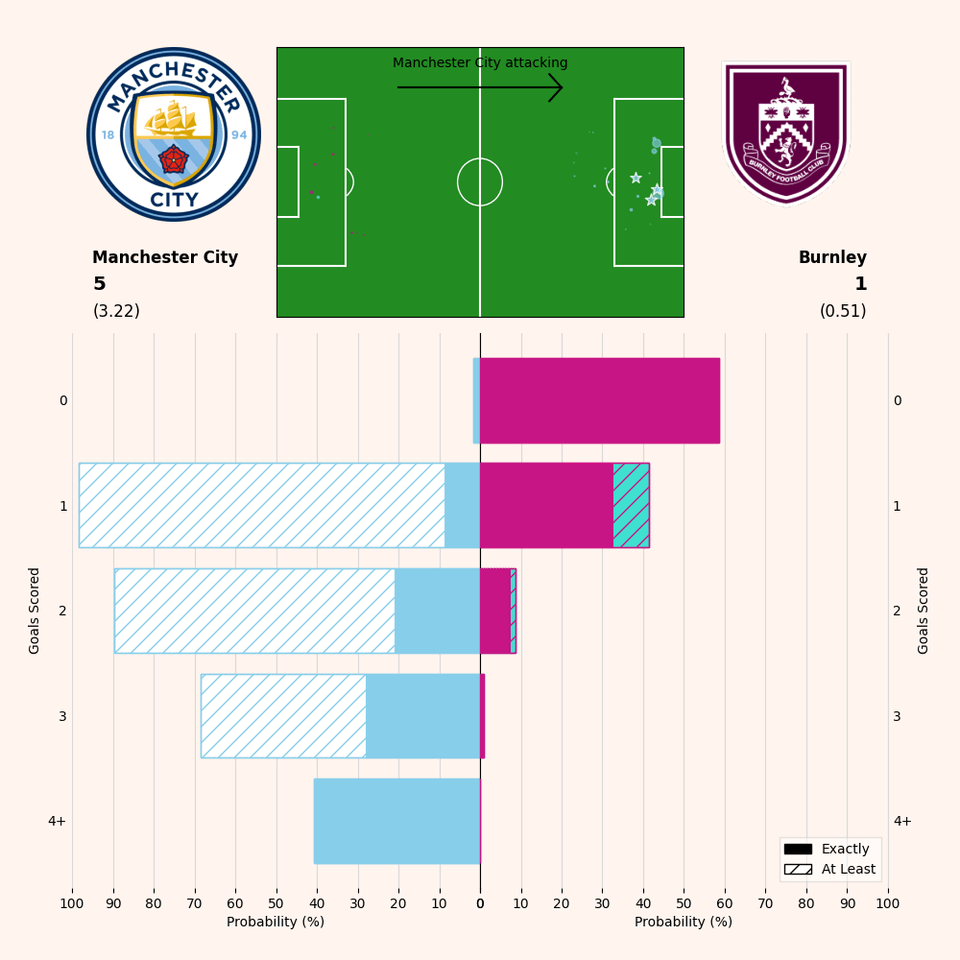
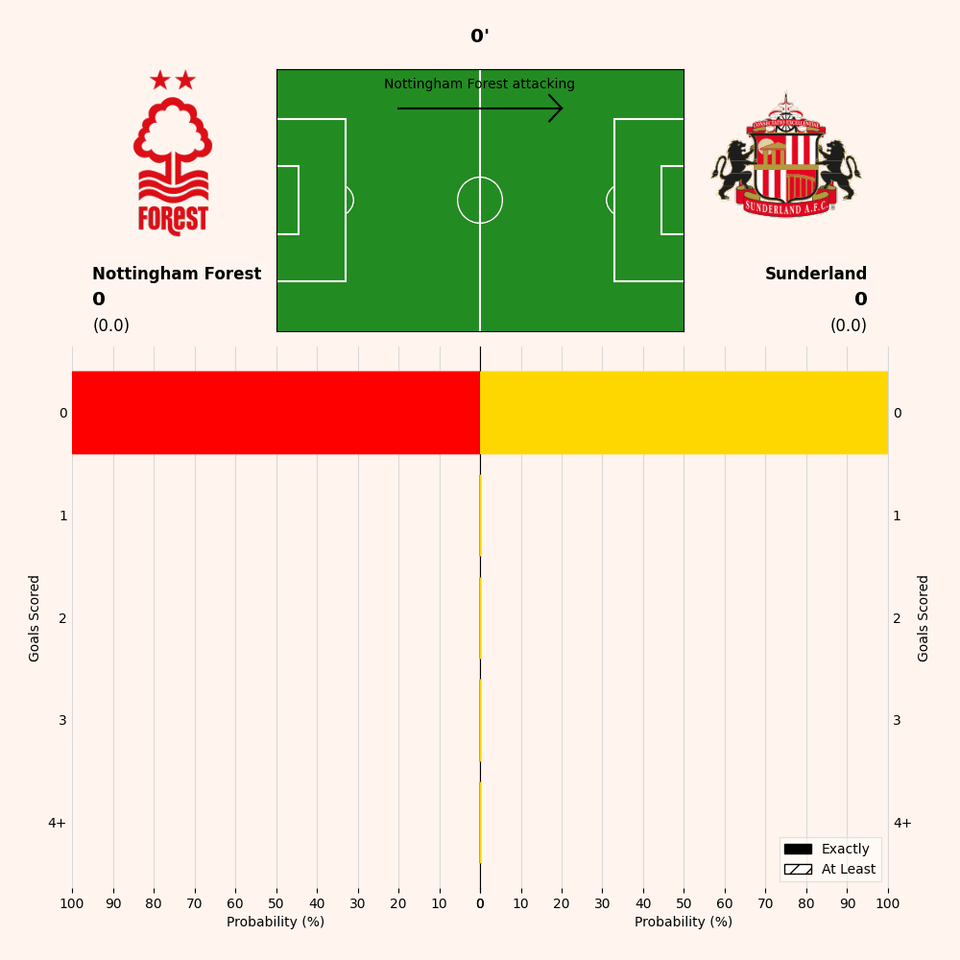
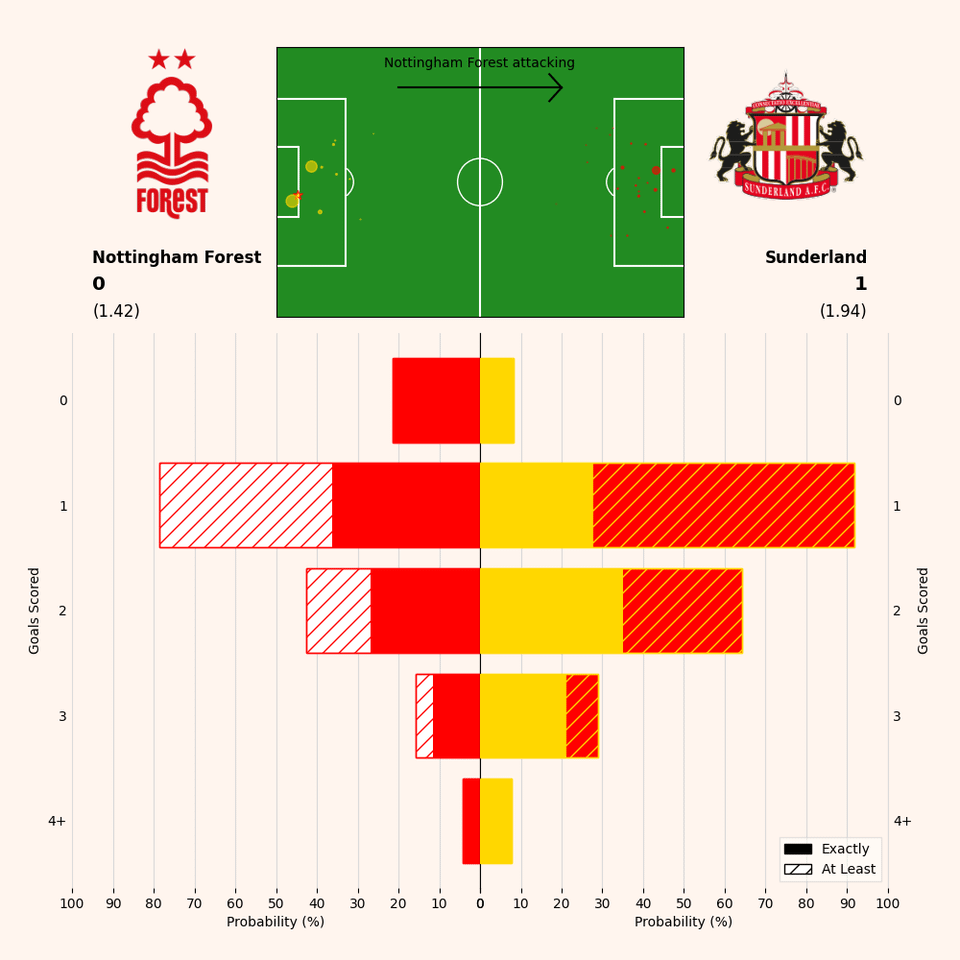
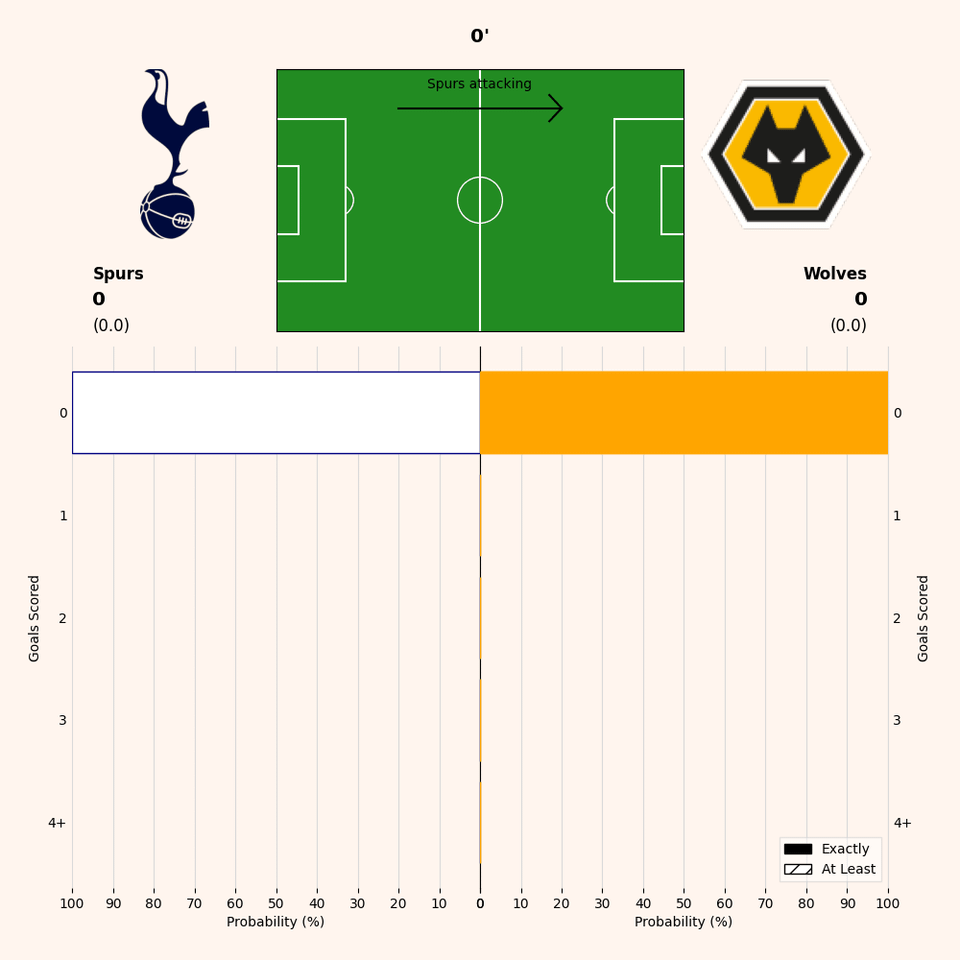
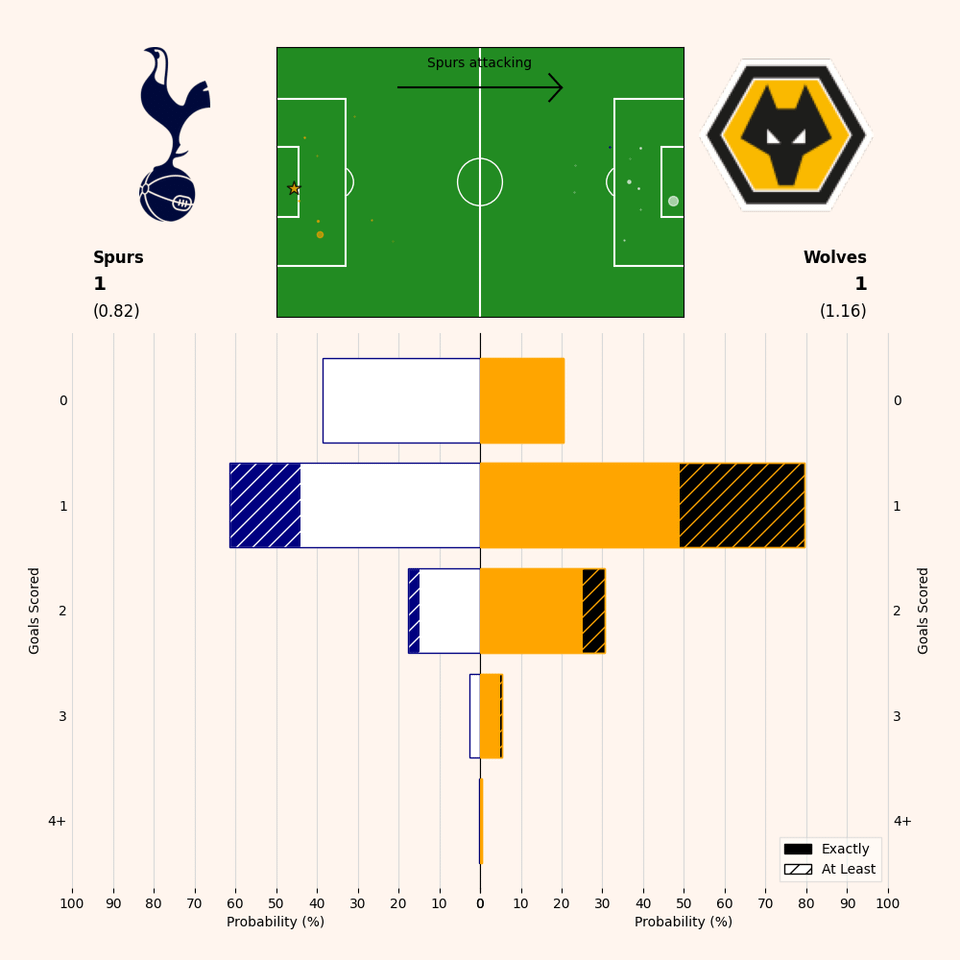
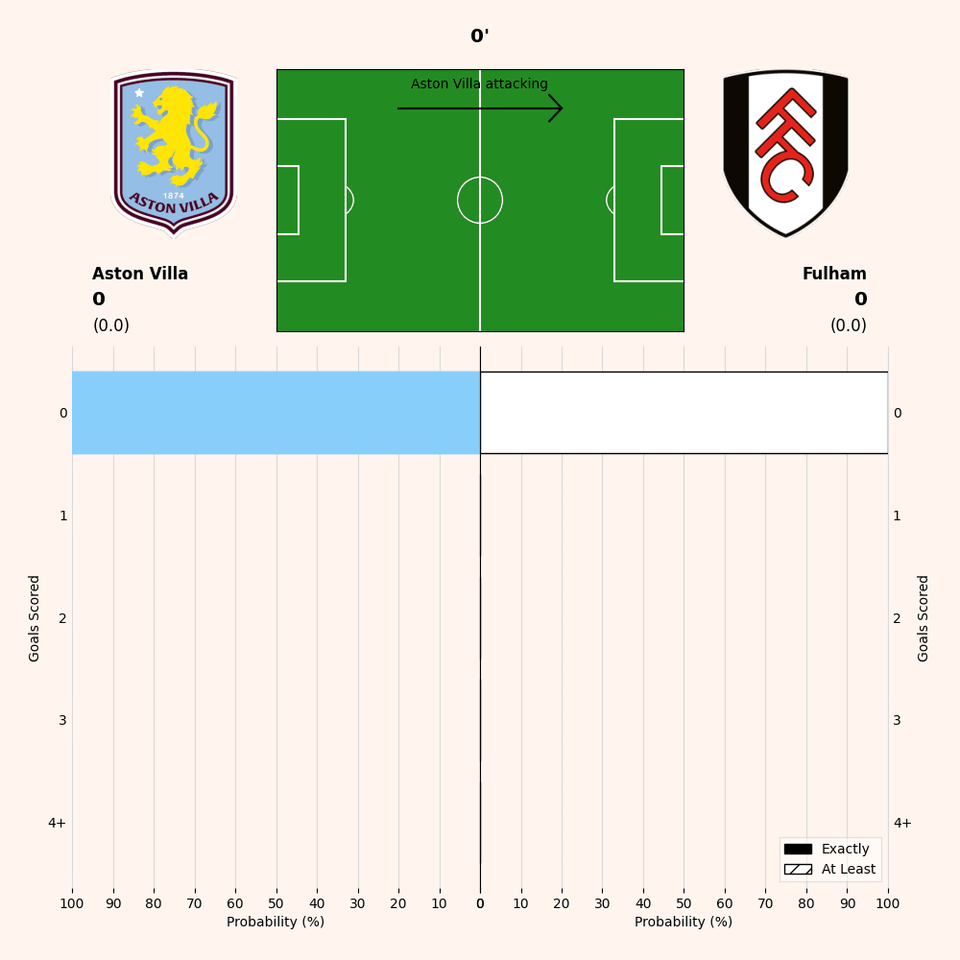
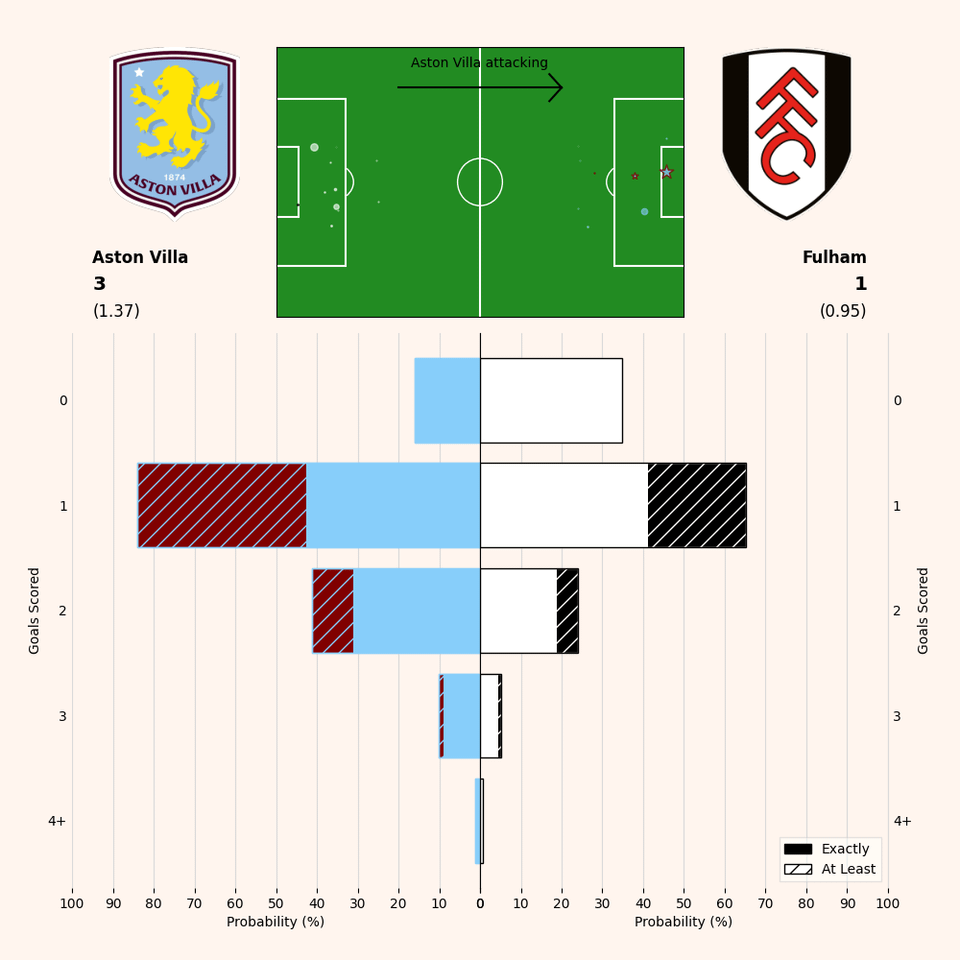
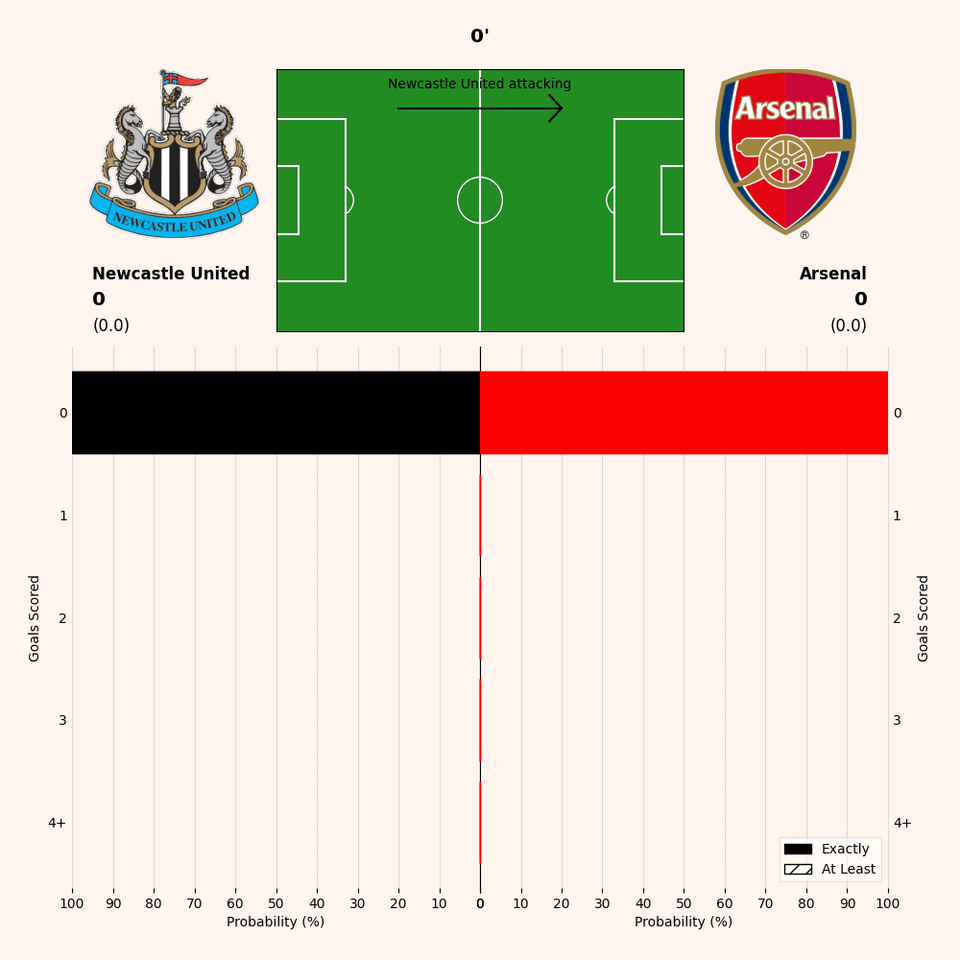
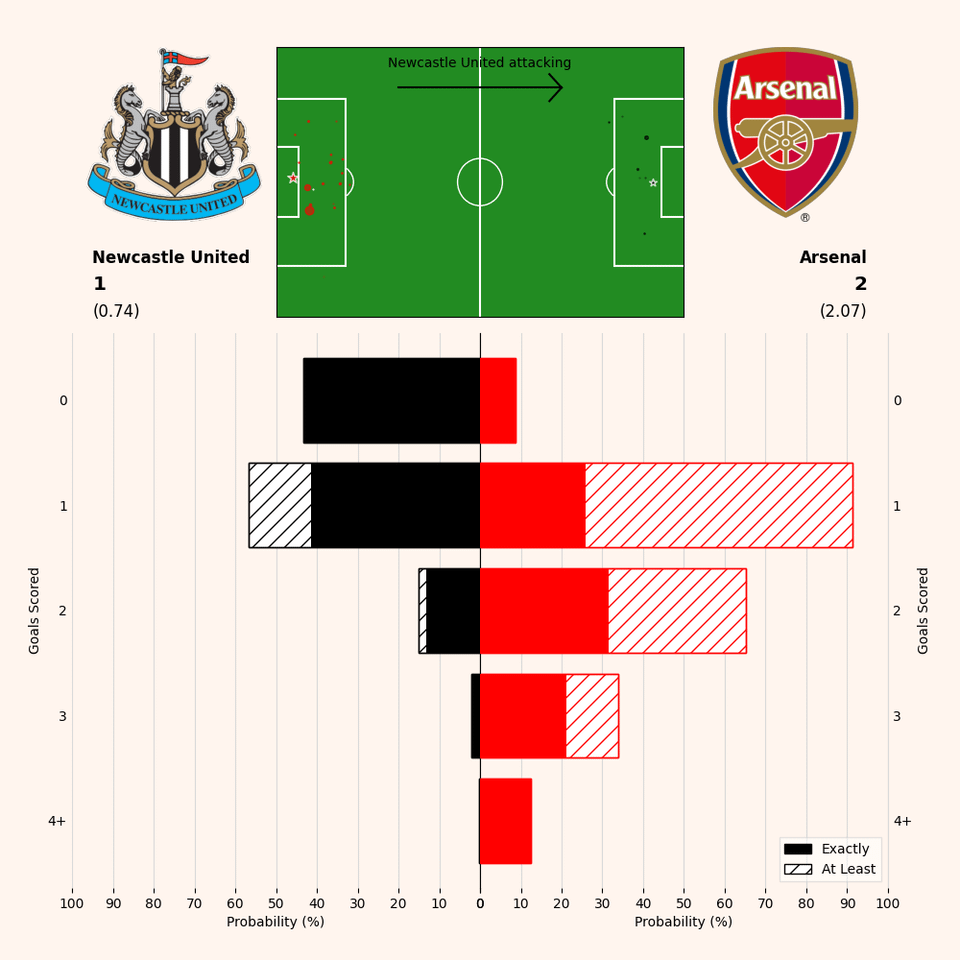
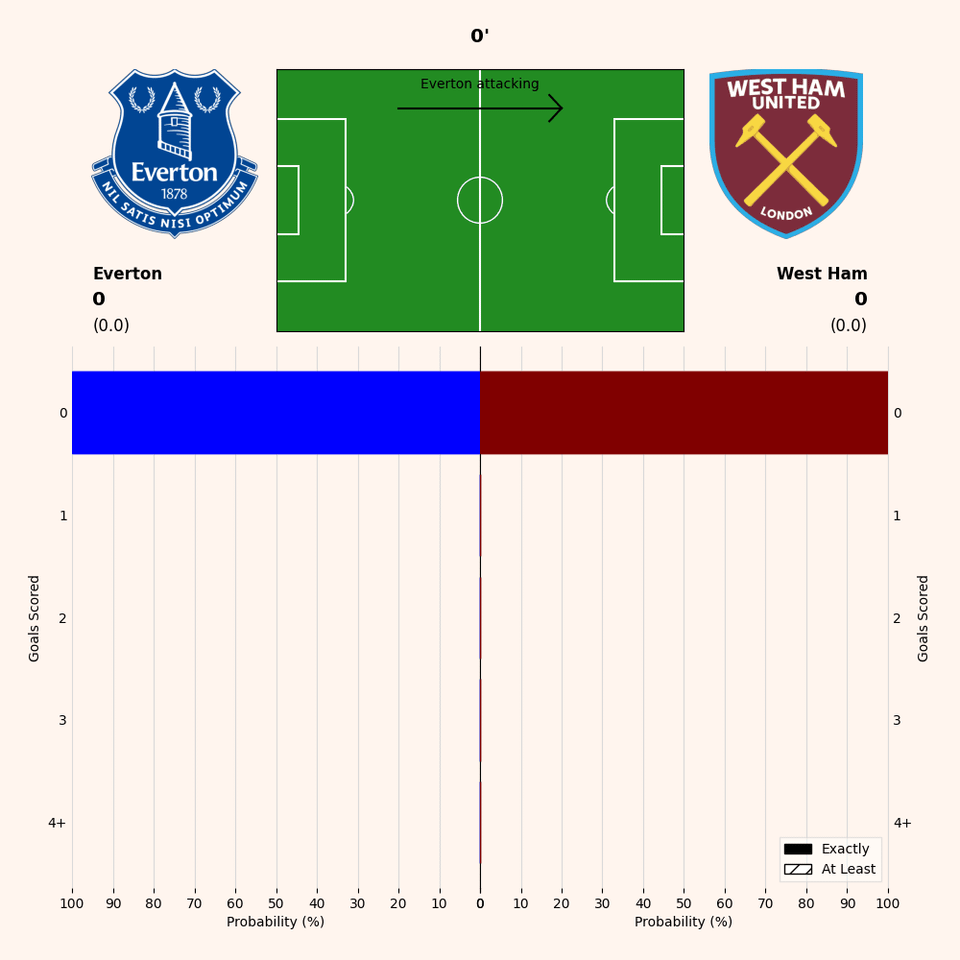
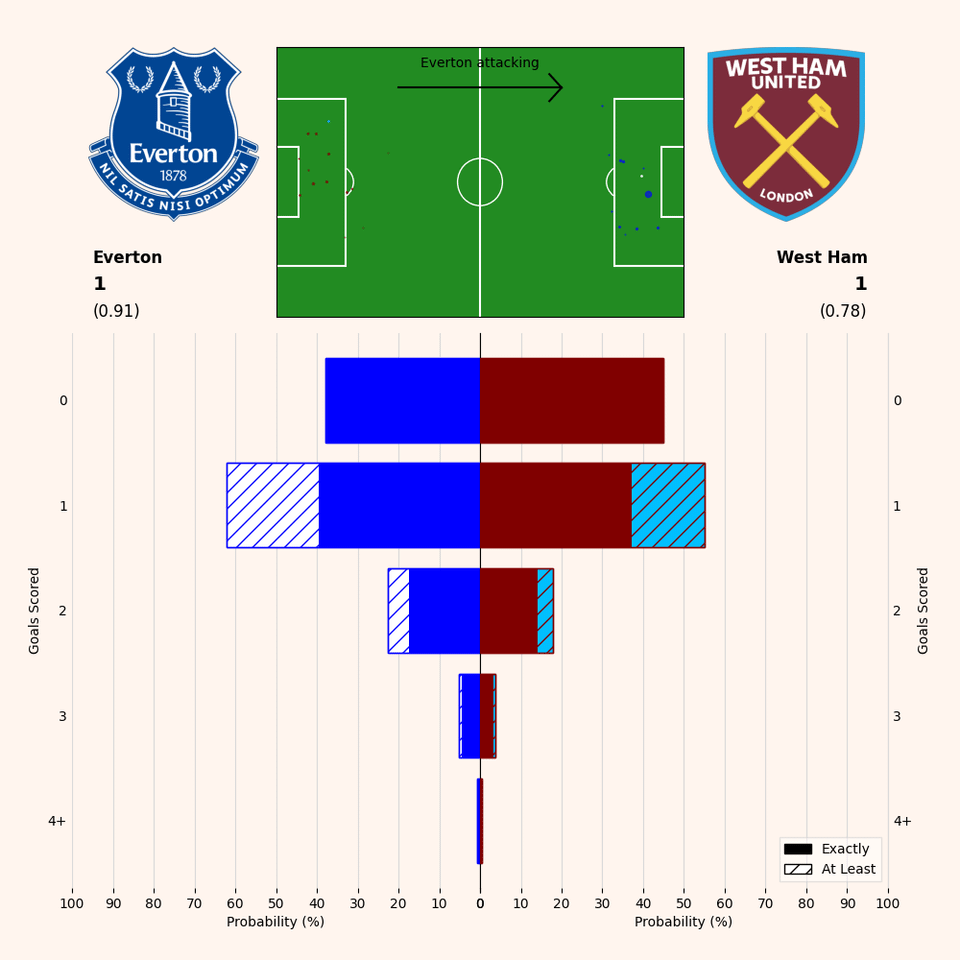
For context on why I made these visualisations, expected Goals (xG) is a common metric used in football analytics which aims to determine the likely number of goals each team would expect to score based on the quality of the shots they had. However, I have had issue with this statistic being presented as a single number at the end of a match, calculated by summing the probability of scoring from each shot/attack. My issue is that a team who had a single shot with a 99% chance of scoring and a team with 99 chances each with a 1% chance of scoring would both have an xG of 0.99, despite the likelihood of the teams not scoring a single goal being 1% vs ~37%.

1 Comment
Data: [understat.com](https://understat.com/)
Tools: python (matplotlib)
For context on why I made these visualisations, expected Goals (xG) is a common metric used in football analytics which aims to determine the likely number of goals each team would expect to score based on the quality of the shots they had. However, I have had issue with this statistic being presented as a single number at the end of a match, calculated by summing the probability of scoring from each shot/attack. My issue is that a team who had a single shot with a 99% chance of scoring and a team with 99 chances each with a 1% chance of scoring would both have an xG of 0.99, despite the likelihood of the teams not scoring a single goal being 1% vs ~37%.