*“Hey guys, let’s establish our 2 biggest cities in these 2 random spots!”*
…and the tornadoes took that personally.
hambonecharlie on
The ’50’s were bad for Mcintosh County. Not so much recently.
newsINcinci on
I’m not sure what the name of this is, but this data is likely skewed by population. Maybe it’s “witness bias.” If no one sees a tornado and it didn’t cause structure damage, then it didn’t happen. In areas of high population, someone always sees the tornado.
Alexzander1001 on
Is this real or just theres more reporting of them jn the more populated areas? Also is this all tornados or just touchdowns?
Primsun on
If you only do 1990 to present how does it look?
From the **50s to the 80s** (or 90s) most definitely have a **reporting bias for populated areas**. Once we have better weather tracking, that probably faded.
jlvoorheis on
The NOAA storm archive is honestly a little dicey before the 1990s, except for large/impactful events. Would be more useful to do this for a standard current climatology (1991-2020 say) vs. using the entire time series.
road_chewer on
I like the idea, I think a better map would be to just use the actual track lines themselves, or maybe convert the lines to point features at the tornado start time and doing a dot map. I also think the biases mentioned in other comments need to be considered.
I hope you keep making maps, it takes a lot of practice to do well!
Stay-Funny24601 on
Do… do tornadoes use roads?
ChironXII on
If the wind blows, but nobody’s around to see it, does it form a tornado?
miamigunners on
Would be interesting to see EF-3 and above. Might be less of a clear skew towards population centers.
LemursRideBigWheels on
I read that as “Torpedos per Square 50km”…and wondered if OK has a weird UBoat problem….
RacingPride on
It is absolutely witness bias, HOWEVER, some larger cities of 10,000 people or more can create a “heat island effect” where it may be 2-3° higher temp than in the middle of a field because of pavement and buildings. In a line of thunderstorms that couple of degrees difference could pack enough energy in to create a funnel cloud to fully drop.
So my Storm Spotting training tells me that this map is caused by 80% witness bias, 15% heat islands, 5% dumb luck.
Purplekeyboard on
How strange, the tornadoes mostly show up at the intersections of major highways. I wonder what else could be located at the intersections of major highways?
Well, best not to worry about that, and just enjoy the map!

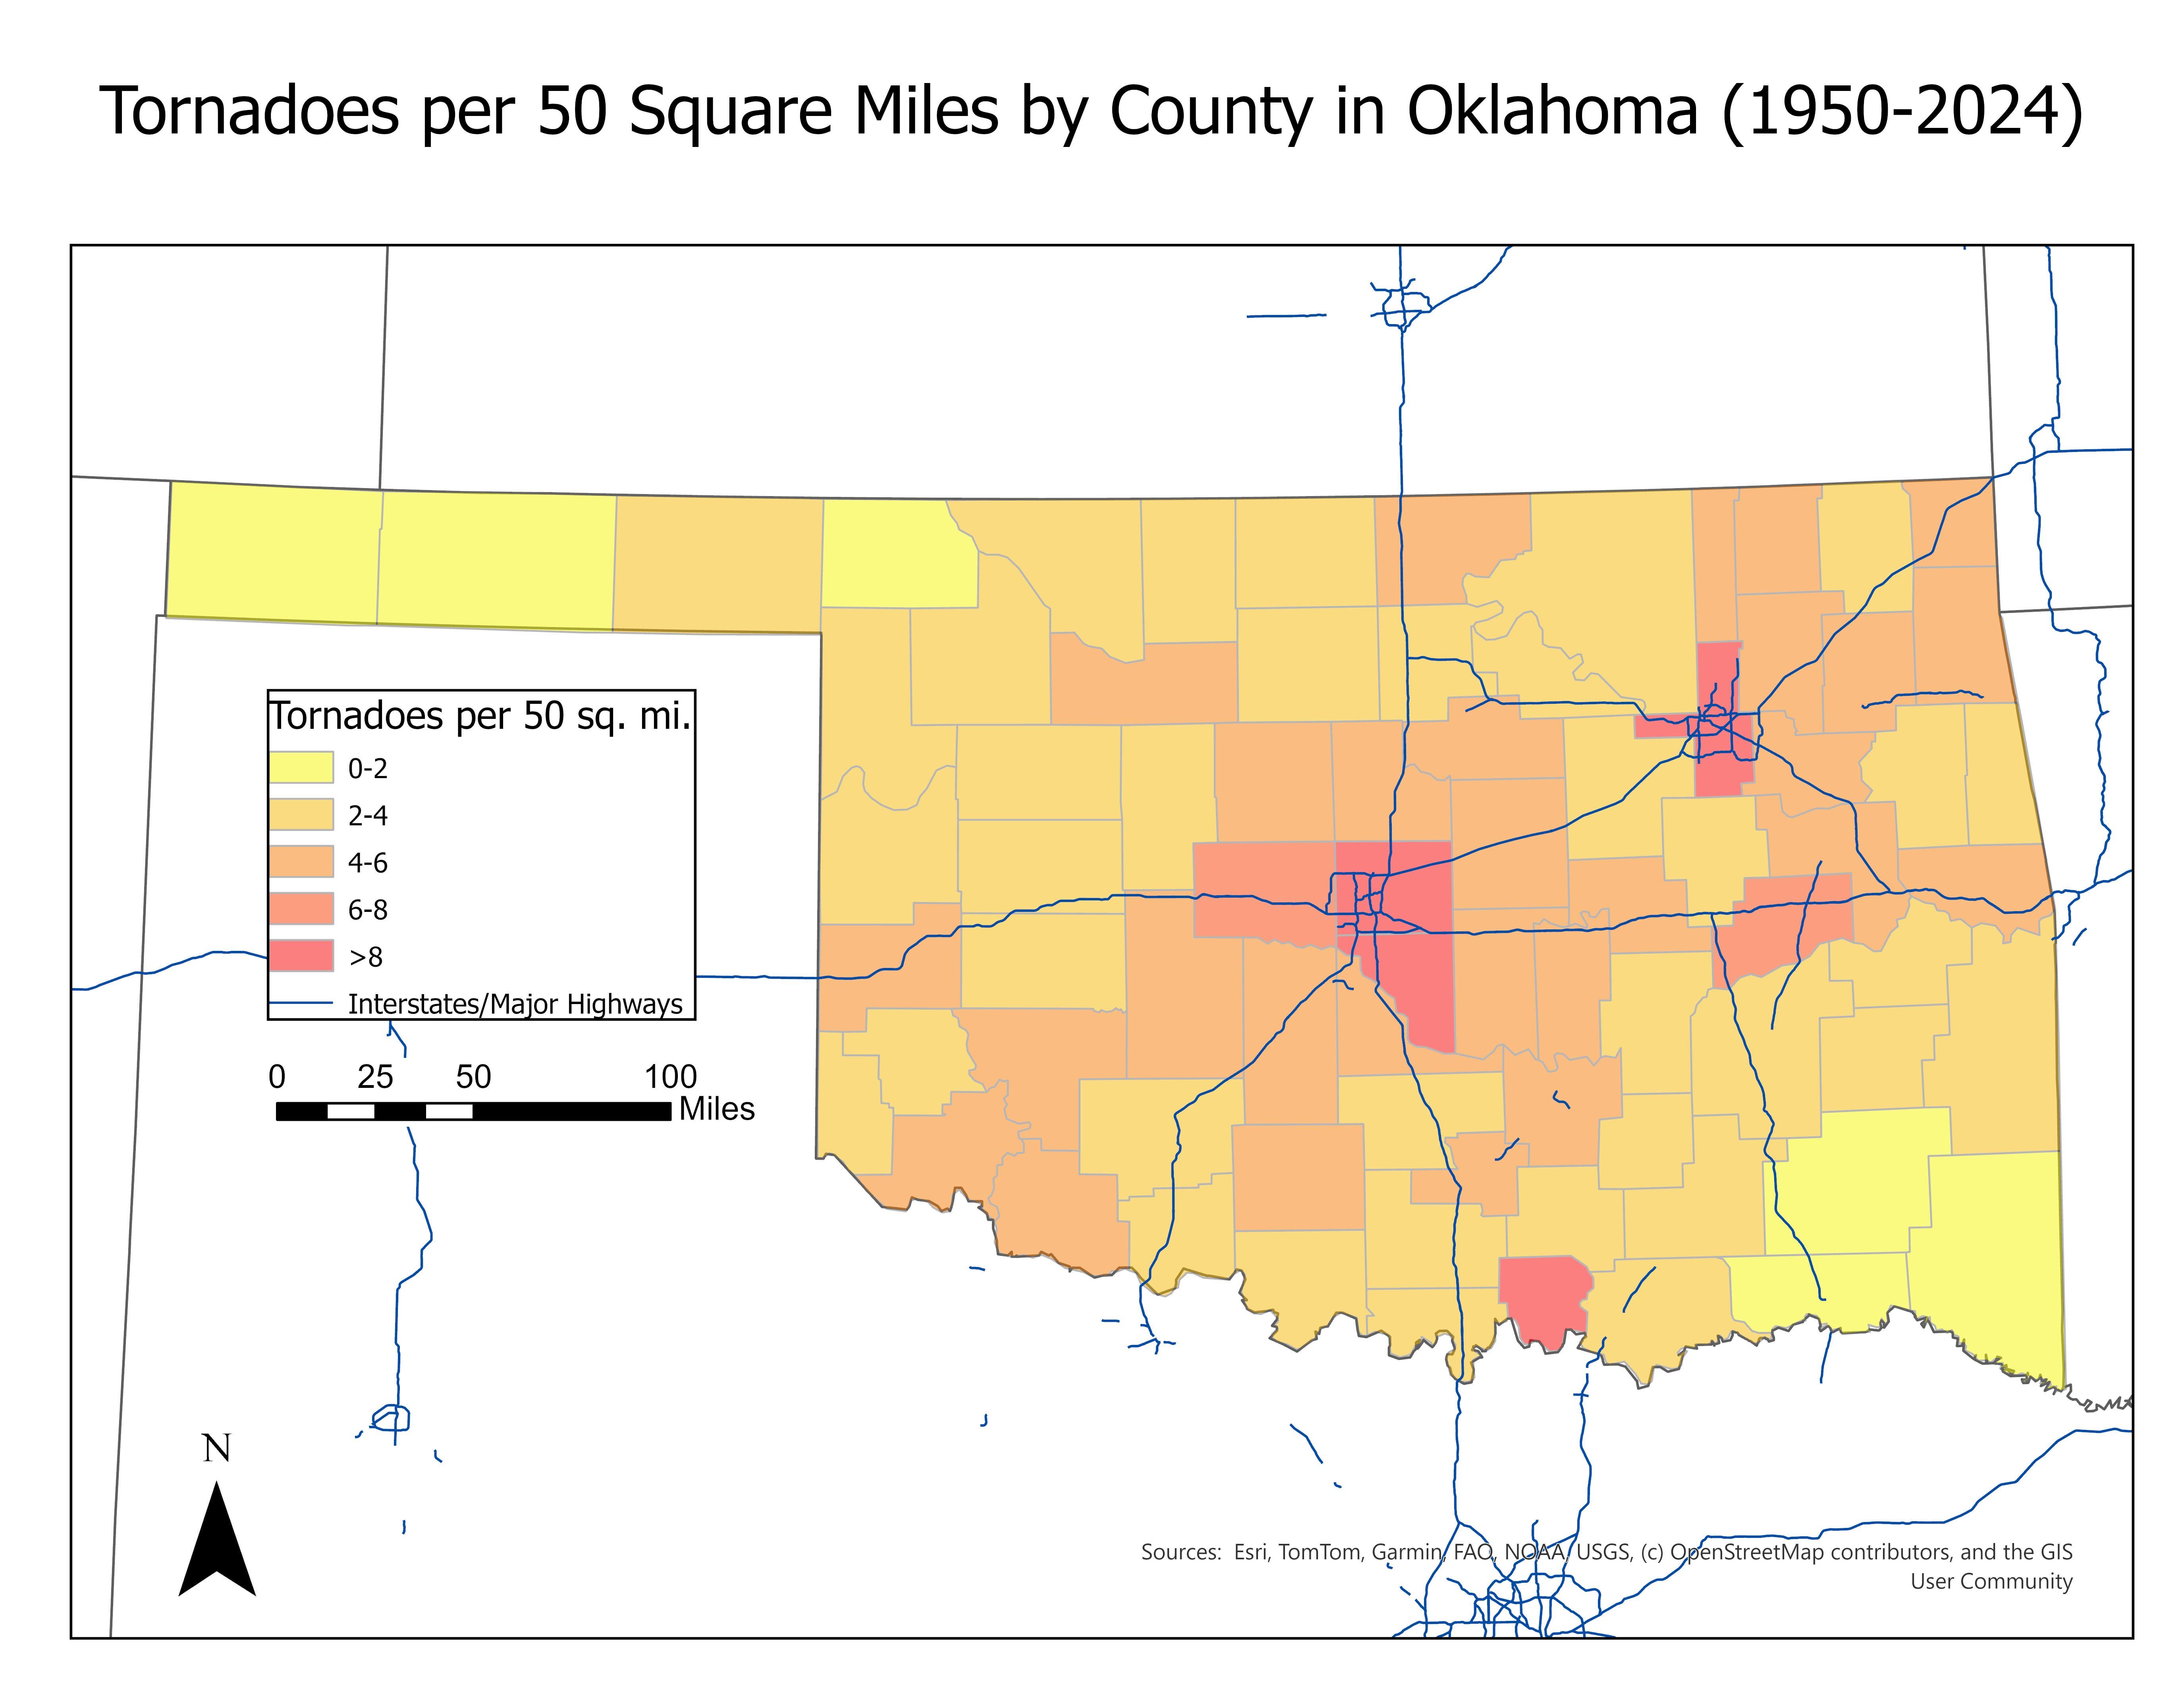
![[OC] Tornadoes per 50 Square Miles by County in Oklahoma (1950-2024)](https://www.byteseu.com/wp-content/uploads/2025/10/npvsbxdmmdtf1-1536x1187.jpeg "[OC] Tornadoes per 50 Square Miles by County in Oklahoma (1950-2024)")
13 Comments
*“Hey guys, let’s establish our 2 biggest cities in these 2 random spots!”*
…and the tornadoes took that personally.
The ’50’s were bad for Mcintosh County. Not so much recently.
I’m not sure what the name of this is, but this data is likely skewed by population. Maybe it’s “witness bias.” If no one sees a tornado and it didn’t cause structure damage, then it didn’t happen. In areas of high population, someone always sees the tornado.
Is this real or just theres more reporting of them jn the more populated areas? Also is this all tornados or just touchdowns?
If you only do 1990 to present how does it look?
From the **50s to the 80s** (or 90s) most definitely have a **reporting bias for populated areas**. Once we have better weather tracking, that probably faded.
The NOAA storm archive is honestly a little dicey before the 1990s, except for large/impactful events. Would be more useful to do this for a standard current climatology (1991-2020 say) vs. using the entire time series.
I like the idea, I think a better map would be to just use the actual track lines themselves, or maybe convert the lines to point features at the tornado start time and doing a dot map. I also think the biases mentioned in other comments need to be considered.
I hope you keep making maps, it takes a lot of practice to do well!
Do… do tornadoes use roads?
If the wind blows, but nobody’s around to see it, does it form a tornado?
Would be interesting to see EF-3 and above. Might be less of a clear skew towards population centers.
I read that as “Torpedos per Square 50km”…and wondered if OK has a weird UBoat problem….
It is absolutely witness bias, HOWEVER, some larger cities of 10,000 people or more can create a “heat island effect” where it may be 2-3° higher temp than in the middle of a field because of pavement and buildings. In a line of thunderstorms that couple of degrees difference could pack enough energy in to create a funnel cloud to fully drop.
So my Storm Spotting training tells me that this map is caused by 80% witness bias, 15% heat islands, 5% dumb luck.
How strange, the tornadoes mostly show up at the intersections of major highways. I wonder what else could be located at the intersections of major highways?
Well, best not to worry about that, and just enjoy the map!