
![[OC] Top 20 U.S. States by Clean Energy Production (Hydro, Solar, Wind & Nuclear) — July 2025 -visualized (via T20API)](https://www.byteseu.com/wp-content/uploads/2025/10/2b76jpq53cuf1-1536x815.png "[OC] Top 20 U.S. States by Clean Energy Production (Hydro, Solar, Wind & Nuclear) — July 2025 -visualized (via T20API)")
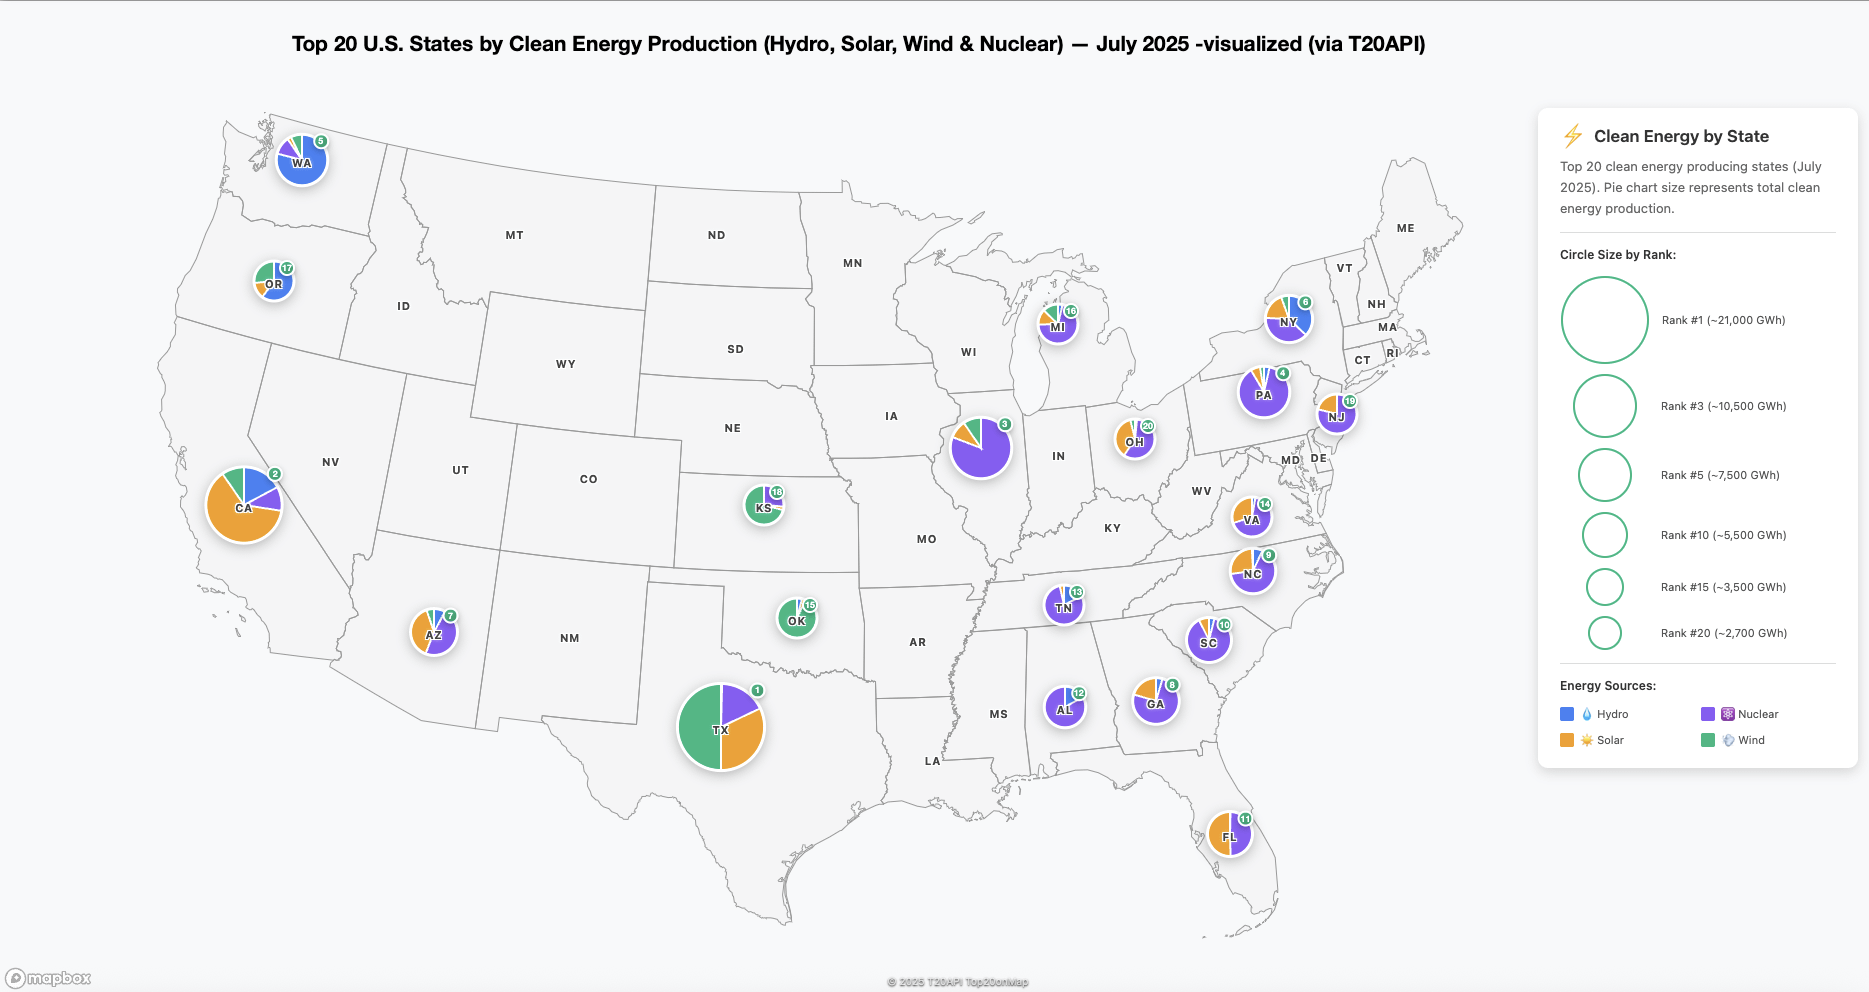
The map reveals how terrain, climate, and legacy infrastructure shape America’s clean power mix — from hydro-rich Northwest to wind-swept Plains to sun-soaked Southwest.
Source: U.S. Energy Information Administration (EIA) via ChooseEnergy.com — “Electricity Sources by State”
Posted by Any_Advertising9743
4 Comments
Visualization : Custom tools- top20onmap T20API [OC]
it would be interesting to see what % is clean energy of the total energy consumed by the states.
I think Alabama has the most hydro in the country, that may be by percentage or something. Also I could be wrong.
Edit: Maybe its most hydro dams.
Nice work Texas.
Unfortunately,[ DoE considers Texas to built out for wind.](https://www.energy.gov/eere/wind/articles/enabling-wind-power-nationwide)