Data sourced from: https://www.kaggle.com/code/ambarish/fun-in-text-mining-with-simpsons
Graphs created using ggplot2 in R
Posted by MendelAndTheGene


Data sourced from: https://www.kaggle.com/code/ambarish/fun-in-text-mining-with-simpsons
Graphs created using ggplot2 in R
Posted by MendelAndTheGene
5 Comments
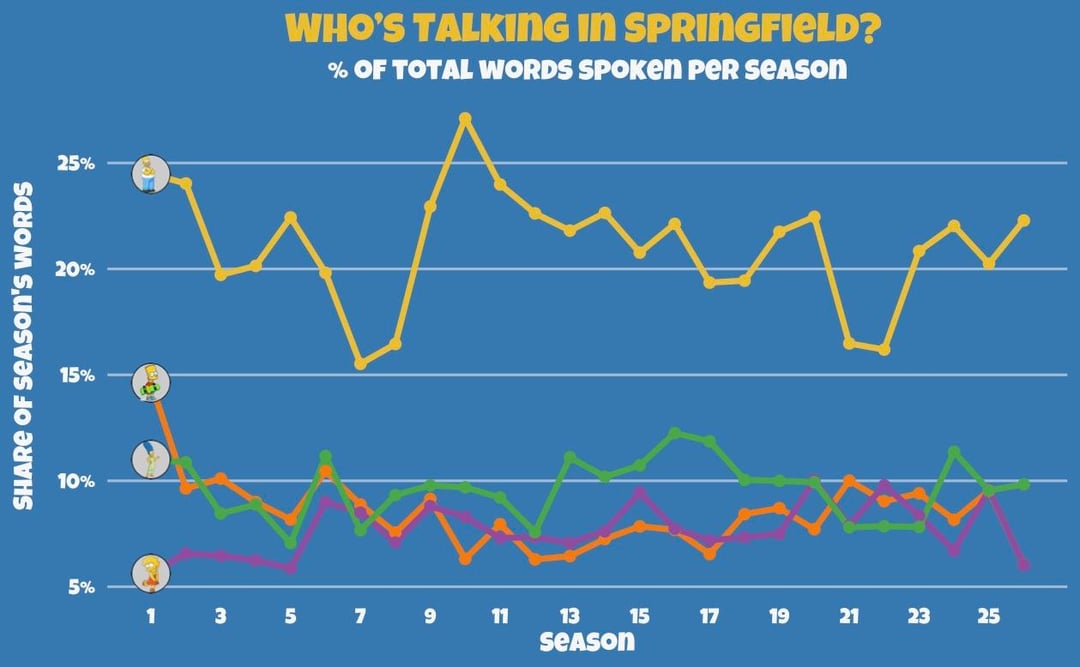
I always thought the show was about Bart. Apparently not
The patriarchy strikes again 😔
That show has to end. Stopped being funny in 1998
Maggie forgotten about, yet again
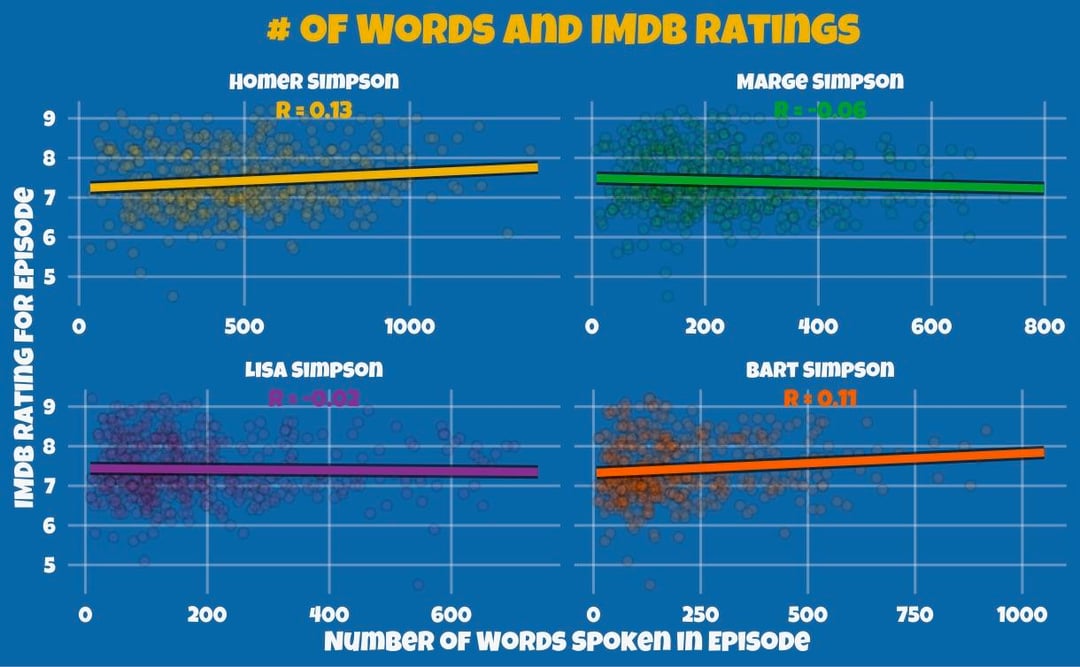
It looks good, but I don’t think that the r value is the main point. Is the regression significant? If yes, what is the slope of the regression line?