
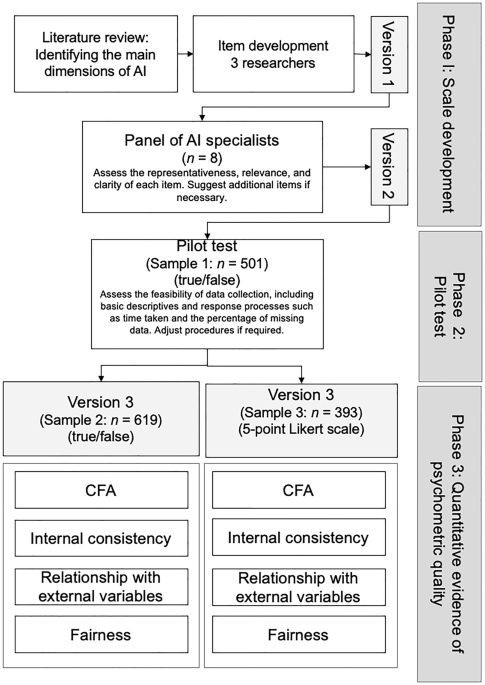
To identify and define the scale domain, we based our work on Long and Magerko (2020). We conceptualized our scale along four areas of knowledge that define AI literacy with different competencies: 1. What is AI? 2. What can AI do? 3. How does AI work? 4. How should AI be used?
To develop the scales, we considered that each of these competencies should be represented in the broader dimension. As for item format, we considered the true/false format to be the most suitable as we were assessing factual statements. In total, the initial formulation of the scale contained 131 items across 13 competencies that were themselves nested in the four aforesaid areas of knowledge/themes (henceforth themes). The themes and competencies are outlined in Table A3 (see Supplementary Material).
In terms of the expert evaluation of the subject matter, we initially assessed interrater reliability. A detailed reliability analysis is provided in Table A3 (Supplementary materials). From the initial pool of 131 items, 39.4% (n = 41) remained unchanged, while 26.9% (n = 28) required adjustments. 24.0% (n = 25) of items were excluded, and consensus could not be reached for 9.6% (n = 10), primarily the items related to the theme “How should AI be used?” Some examples of these changes are provided in the Supplementary material (Table A4). Following the experts’ suggestions, existing items were modified, and new items were created to address perceived gaps. This was especially crucial for Theme 4, which had issues with construct representativeness, leading to a complete overhaul in accordance with Long and Magerko’s (2020) definitions. As a result of this phase, Version 2 of the scale was produced, comprising 103 items across the 13 competencies.
Phase 2: pilot test
Table A5 presents the results of the one-dimensional EFA for individual competences, excluding competence 12 (refer to 5.2.3). As shown, the results are favorable, but the reliability indicators have low values. In this initial phase, following a meticulous examination of item difficulty and discrimination, 23 items were excluded.
What is AI?
The results of the parallel analysis indicated either a one-dimensional or a two-factor solution for EFA, which both align with the theoretical framework. Through successive modeling, we identified items with low factor loadings. After reviewing their content, we considered removing items that did not significantly impact the representativeness of these competences. Ultimately, we evaluated two EFA solutions, one comprising a single factor with 14 items (factor loadings range 0.19 to 0.67; X2 = 105.37[77], p = 0.02, CFI = 0.92, TLI = 0.91, RMSEA [90%IC] = 0.03 [0.01, 0.04]); α = 0.59, ω = 0.61) and one comprising a two-factor solution (also with 14-items), we obtained a factor including items from three competences (i.e., Recognizing AI, Understanding Intelligence and Interdisciplinarity of AI labeled as RUI) and one including items of General vs Narrow. For the first factor, loadings ranged from 0.42 to 0.68, except for one item of C3 (“Computer vision is an example of interdisciplinary AI technology”) that had a loading of 0.21. We decided to keep it due to the representativeness of this competence in the scale. As for the second factor, loadings ranged from 0.56 to 0.78. GOFI were excellent (X2 = 85.65[77], p = 0.21, CFI = 0.97, TLI = 0.97, RMSEA[90%IC] = 0.02 [0.00, 0.03]). Internal consistency reliability was low, which could be explained by the low variance of the items (RUI: α = 0.51, ωc = 0.52; General vs Narrow: α = 0.50, ω = 0.51).
What can AI do?
The results of parallel analysis suggested either two or three factors. We finally opted for a 2-factor model, as it aligns more closely with the theoretical background. Consequently, we present a scale comprising four items for AI strengths and four for AI weaknesses (X2 = 47.46[26], p = 0.01, CFI = 0.98, TLI = 0.98, RMSEA[90%IC] = 0.02 [0.00, 0.03]). For the strengths, we obtained an ωc of 0.56 and a α = 0.56, and for the weaknesses factor we obtained an ωc of 0.49 and a α of 0.46.
How does AI work?
On initial inspection, 12 items were deemed unsuitable and subsequently removed. Parallel analysis indicated a one-factor solution for this dimension. After exploring the initial solution, four items were removed. Given our aim for this dimension was to encompass all theoretical competences, we reviewed item content and difficulty, leading to the exclusion of an additional four items. The final version of this dimension comprises 23 items, representing all competencies. GOFI were adequate (X2 = 328.75(230), p = <0.001, CFI = 0.94, TLI = 0.93, RMSEA[90%IC] = 0.03[0.03, 0.04]). We obtained adequate internal consistency reliability estimates for the general score (ωc = 0.75, α = 0.72).
How should AI be used?
Parallel analysis suggested the presence of one or two dimensions. However, no theoretically compatible solution was found for a two-factor dimension. For the single-factor solution, we conducted three iterative analyses, systematically excluding items, resulting in a final version comprising 10 items, where at least one item of each ethics domain (e.g., transparency, accountability, regulation, privacy, trust, freedom, justice, dignity) remained. The final solution was deemed adequate (X2 = 45.71(35), p = 0.11, CFI = 0.97, TLI = 0.97, RMSEA[90%IC] = 0.02 [0.00, 0.04]) and internal consistency reliability values were as follows: ωc = 0.70, α = 0.66.
Considerations for Phase 3
The pilot phase and subsequent analysis of results led to the development of an AI literacy tool with four distinct themes. The first scale, “What is AI?”, comprises two dimensions: RUI (10 items) and General vs. Narrow (4 items), totaling 14 items. The second scale, “What can AI do?”, also features two dimensions, evaluating the strengths (5 items) and weaknesses (4 items) of AI, totaling 9 items. The third scale, “How does AI work?”, consists of 23 items measuring a unidimensional scale. Lastly, “How should AI be used?” is also unidimensional, featuring 10 items.
While the evidence for the internal structure validity of the test scores remains robust, the reliability of the scales is often below the desirable threshold for research. This might be attributed in part to the binary (true-false) response scale used and the low variability found. Therefore, in Phase 3 data was also collected using a scale that features a greater number of categories, in addition to data collection with the original true-false response format.
Phase 3: quantitative evidence of psychometric quality
Table 1 presents GOFI for the measurement models in Phase 3. Descriptive statistics and internal consistency reliability coefficients for the mean scores derived from the final models are provided in Table 2.
What is AI?
We evaluated the two proposed models that were previously considered in Phase 2. Initially, we examined a one-factor model, which exhibited GOFI in both samples. Subsequently, we tested the proposed two-factor solution from Phase 2. This comprised RUI and General and Narrow competences. Factor loadings for both models are depicted in Fig. A1. While both samples demonstrated adequate GOFI, and factor loadings were similar, internal consistency reliability was higher with the 5-point Likert scale response.
As detailed in Table 2, for Sample 2, the mean scores were 0.86 and 0.87 for the factors, indicating that, on average, individuals answered most items correctly. Conversely, for the Likert scale, the mean scores were 3.82 and 3.45, suggesting that, on average, respondents had a moderate level of confidence in their responses. Consequently, the interpretation of test scores differs depending on the scale response utilized.
What can AI do?
Based on the findings from Phase 2, we examined a model featuring two factors (strengths and weaknesses). However, this model yielded unsatisfactory GOFI for Sample 2 and could not be tested for Sample 3 due to convergence issues. Negative variances were observed in the items of the weakness dimension, prompting further investigation into the independence of the two dimensions. As shown in Table 1, GOFI for both samples were excellent for the strengths dimension but unacceptable for the weakness dimension. Factor loadings were consistently high and uniform across both samples (see Fig. A2 for standardized factor loadings). Once again, internal consistency reliability was superior for Sample 3, with values reaching acceptable levels.
How does AI work?
The model initially proposed in Phase 2 proved to be suitable for both samples. The standardized factor loadings are detailed in Table A6. The internal consistency reliability estimates are adequate for both samples, with Sample 3 demonstrating slightly better results. Across both samples, the participants exhibit a strong understanding of how AI works.
How should AI be used?
Finally, the ethics scale exhibits excellent GOFI for both samples (see Table A7 for standardized factor loadings). However, internal consistency reliability is not deemed adequate for Sample 2, but when considering the mean scores of both samples, the participants generally possess a good understanding of how AI should be used.
Measurement Invariance
Table A8 (Supplementary materials) provides the measurement invariance for both samples, considering the participants’ gender and level of education. For the dimension “What is AI?”, metric and scalar invariance were achieved for both Sample 2 and Sample 3 with respect to gender. However, metric invariance was achieved across education groups, suggesting varying factor loadings based on this item. In the dimensions of strengths in “What can AI do?” and “How should AI be used?”, metric and scalar invariance were established for gender and education in both samples. Therefore, the interpretation of scores is comparable across groups. Unfortunately, invariance in the dimension “How does AI work?” could not be studied due to convergence issues in the models.
Evidence of validity based on relationships with external variables
Evidence of discriminant and convergent validity
Table 3 presents correlations between the developed scales and external measures. The purpose of the first set of correlations (1–5) is to establish evidence of discriminant validity, demonstrating that although the developed scales assess AI literacy, they are distinct from each other. Second, we aim to provide convergent evidence by examining correlations with externally used instruments.
Correlations exhibit consistent directionality across both the dichotomous response scale and the 5-point scale, with generally higher correlations observed in the latter. In terms of discriminant relationships, correlations tend to be low, except for F1 with “How should AI be used?” (Sample 1: r = 0.51; Sample 2 r = 0.63) and General vs Narrow with “How should AI be used?” (Sample 1: r = 0.32; Sample 2: r = 0.41).
In terms of expected convergent relationships, correlations for Sample 1 are generally low. However, for Sample 2, moderate positive correlations are observed between RUI and ATAI acceptance, moderate negative correlations between RUI and ATAI fear, and moderate positive correlations between “What Can AI do?” and ATAI acceptance.
Differences between gender and level of education
Table 4 displays gender differences for the variables examined in both samples. Across both samples, men tend to score higher than women in RUI and “How does AI work?” In Sample 2, the effect size is moderate, while in Sample 3, it is high. Furthermore, in Sample 3, differences are also observed in “General vs Narrow,” with men obtaining higher scores than women. No differences were detected in “How does AI work?” However, it is important to interpret these group differences with caution, as invariance between the groups could not be examined.
Table 5 presents group differences by education. In both samples, individuals with higher levels of education tend to score higher in RUI, with the effect size more pronounced in Sample 3 than in Sample 2. However, invariance cannot be established for this variable in Sample 3, so the results should be interpreted with caution.
Additionally, in Sample 2, differences are observed in “What can AI do?”. Individuals with lower levels of education score higher (reverse scale), indicating lower knowledge compared to those with higher levels of education. Similarly, individuals with higher levels of education tend to score higher in “How does AI work?”