

This section presents the results of the correlation analysis, the application of linear and nonlinear regression models, and a comparison of their performance. The SLR model serves as a linear baseline, while SVR, RF, and MLP are implemented as nonlinear models to capture more complex patterns in the data. In the end, the mean squared error (MSE), mean absolute error (MAE), and coefficient of determination (R2) are presented in detail, and permutation feature importance is applied.
Correlation matrix
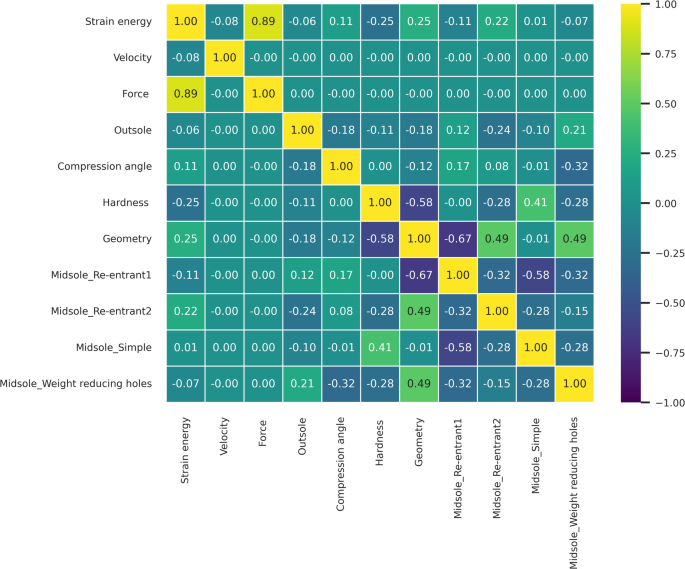
The correlation matrix, presented in Fig. 6 heatmap, highlights the factors influencing strain energy. In the heatmap, yellow indicates strong positive correlations, purple indicates strong negative correlations, and cyan represents low or negligible correlations. Based on the correlation matrix, strain energy exhibits a strong dependence on reaction force, which stands out significantly compared to other features. This is followed by geometric features and shoe hardness, both showing a correlation of approximately 0.25. While most midsole structures demonstrate correlations below 0.15, the Re-entrant 2 structure exhibits a relatively higher correlation of 0.22. Compression angle also correlates with strain energy, although its impact is weaker compared to reaction force, geometry, hardness, and the Re-entrant 2 structure. Other features, such as outsole design and loading speed, show negligible correlations, with values below 0.1.
To validate these findings, multi-factor ANOVA tests were conducted, and all p values were significant (p < 0.05), confirming the reliability of the correlation results (Table 2). Tukey’s post-hoc comparisons further identified significant differences among the tested parameters (Table 3):
-
Loading speed: Strain energy decreased with increasing speed. At 70 N/s (mean = 2.958 J, A), strain energy was significantly higher than at 80 N/s (mean = 2.664 J, B) and 800 N/s (mean = 2.600 J, B).
-
Force: Strain energy increased progressively with force: 600 N (mean = 1.344 J, A), 900 N (mean = 2.641 J, B), and 1200 N (mean = 4.238 J, C).
-
Midsole: While Re-entrant2 (mean = 3.010 J, A), simple (mean = 2.978 J, A), and Re-entrant1 (mean = 2.896 J, A) designs showed no significant differences, the weight-reducing holes design (mean = 2.080 J, B) exhibited significantly lower strain energy.
-
Outsole: The cut grooves design (mean = 2.784 J, B) resulted in higher strain energy compared to the simple design (mean = 2.697 J, A).
-
Compression angle: A 0-degree angle (mean = 2.839 J, A) produced higher strain energy compared to a 12-degree angle (mean = 2.643 J, B).
-
Hardness: 40 Shore A (mean = 2.973 J, A) resulted in higher strain energy compared to 50 Shore A (mean = 2.508 J, B).
-
Geometry: The wide toe design (mean = 3.080 J, B) produced significantly higher strain energy compared to the narrow toe configuration (mean = 2.401 J, A).
Corresponding confidence interval plots illustrating these group differences are provided in Appendix 1, offering visual confirmation of the statistical separation among categories and supporting the validity of the post-hoc results.
Target and feature imbalance assessment
Figure 7 displays the strain energy distribution using a histogram and kernel density estimate (KDE), revealing a right-skewed yet continuous spread. The dataset includes a good mix of low, moderate, and high values, suggesting a naturally balanced target. Given this distribution, applying synthetic balancing strategies such as SMOTER (Synthetic Minority Over-sampling Technique for Regression) may not be necessary. Avoiding SMOTER helps preserve data integrity, prevent overfitting, maintain interpretability, and avoid complex hyperparameter tuning. Although the target variable is balanced, features such as the midsole show mild imbalance (Table 1). The maximum repetition ratio between cases reaches 216/72 = 3 (re-entrant 1 vs. re-entrant 2). To prevent the introduction of additional imbalance into the target, this feature imbalance is intentionally retained.
Figure 7 displays the strain energy distribution using a histogram and kernel density estimate (KDE), revealing a right-skewed yet continuous spread. The dataset includes a good mix of low, moderate, and high values, suggesting a naturally balanced target. Given this distribution, applying synthetic balancing strategies such as SMOTER (Synthetic Minority Over-sampling Technique for Regression) may not be necessary. Avoiding SMOTER helps preserve data integrity, prevent overfitting, maintain interpretability, and avoid complex hyperparameter tuning. Although the target variable is balanced, features such as the midsole show mild imbalance (Table 1). The maximum repetition ratio between cases reaches 216/72 = 3 (re-entrant 1 vs. re-entrant 2). To prevent the introduction of additional imbalance into the target, this feature imbalance is intentionally retained.
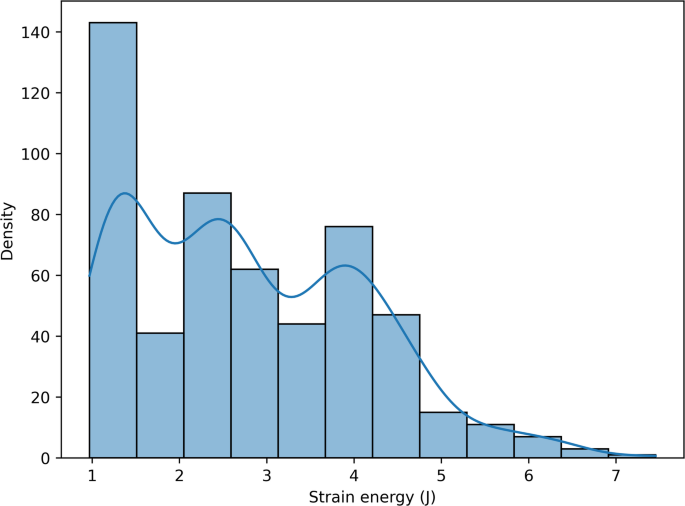
Distribution of strain energy across samples, represented by a histogram with an overlaid kernel density estimate (KDE).
Simple linear regression (SLR)
After performing SLR, the model coefficients for each feature were summarized in Table 4, with an intercept of − 0.2932. MSE was 0.0581, which was relatively low compared to the variance of the training data (1.0019), suggesting a good fit. Furthermore, the model explained 93% of the variance in the data, demonstrating a high level of predictive accuracy. The Mean Absolute Error (MAE) was 0.1762 J, further supporting the model’s effectiveness in minimizing prediction errors and reinforcing its reliability in capturing the underlying data trends.
In terms of feature importance in the SLR model (Table 4), force (0.9102) is the most influential factor, indicating that greater applied force substantially increases strain energy. This is followed by geometry (0.5392) and midsole configurations such as Re-entrant 2 (0.2172), Simple (0.1877), and Re-entrant 1 (0.1107), all contributing positively to strain energy. Minor positive effects are also observed for outsole (0.0787) and compression angle (0.0725). In contrast, the weight-reducing holes in the midsole (− 0.5156) show a strong negative impact on strain energy. Similarly, though to a lesser extent, hardness (− 0.1787) and loading speed (− 0.0849) also negatively affect strain energy. It is worth noting that these findings differ from the permutation feature importance results presented in Section “Permutation feature importance”. In that section, permutation importance was applied uniformly across all models, including those such as SLR and MLP, which do not inherently provide feature importance through their internal parameters.
Support vector regression (SVR)
This algorithm was executed using four cores with five-fold cross-validation applied to all cores. By tuning the hyperparameters through a search algorithm, the optimal values shown in Table 5 were identified, corresponding to the lowest MSE for each core. Among the kernels tested, the sigmoid kernel performed poorly. This is likely due to its inherent limitations. The sigmoid function compresses input values into a narrow output range (typically [0,1] or [− 1,1]), which restricts its ability to represent functions with wide variations. Furthermore, the sigmoid kernel offers a relatively shallow representation of the input space and often struggles to capture the complex, nonlinear relationships typical in strain energy modeling. This can lead to poor separation and generalization, especially when support vectors are unevenly distributed. Additionally, in extreme input regions, the sigmoid kernel becomes saturated—its output changes very little in response to input changes—resulting in reduced sensitivity to subtle but important variations in the data. In contrast, the radial basis function (RBF) kernel, derived from the Gaussian function, effectively models localized and nonlinear patterns by forming smooth, flexible decision surfaces. Consequently, SVR with an RBF kernel yielded substantially better results. The highest accuracy was achieved using a quartic polynomial kernel (Fourth-degree polynomial model), which offered greater nonlinear expressiveness and matched the complex physical behavior of the dataset. Importantly, the same trend observed in MSE was also reflected in MAE: SVR models with the RBF and polynomial kernels produced the lowest average absolute errors, while the sigmoid and linear kernels exhibited much higher MAE values. This reinforces the conclusion that more expressive kernels are better suited for capturing the intricacies of strain energy modeling.
Random forest (RF)
This algorithm, like the previous ones, was executed on the training data with five-fold cross-validation, and its hyperparameters were determined through a grid search. As shown in Table 6, the RF model outperformed the others, achieving the lowest mean squared error (MSE). This superior performance can be attributed to the ensemble nature of RF. The model constructs multiple decision trees, each trained on a different subset of the data generated through bootstrapping. During prediction, it aggregates the results of all individual trees—typically via averaging—which helps smooth out the variance of individual trees and reduces the risk of overfitting. Additionally, RF is well-suited to capturing complex, nonlinear interactions between features, which are common in physical modeling tasks like strain energy estimation. By leveraging both ensemble averaging and randomized feature selection, the model achieves high predictive accuracy and generalization.
Multi-layer perceptron (MLP)
The MLP algorithm was applied to the training data with five-fold cross-validation, with its hyperparameters optimized through grid search. As shown in Table 7, the MLP algorithm demonstrated competitive performance compared to several other models. However, in this specific case, it was outperformed by the RF and SVR with fourth-degree polynomial kernel. Despite this, the MLP algorithm’s performance is expected to improve as the size of the dataset increases, leading to a reduction in the mean squared error due to its capacity to capture complex patterns with more data.
Metrics summary
To comprehensively evaluate model performance and address potential issues of overfitting and underfitting, MAE, MSE, and R2 metrics are computed for three stages: (1) five-fold cross-validation, (2) training dataset, and (3) test dataset. The results are summarized in Table 8 and shown in Fig. 8.
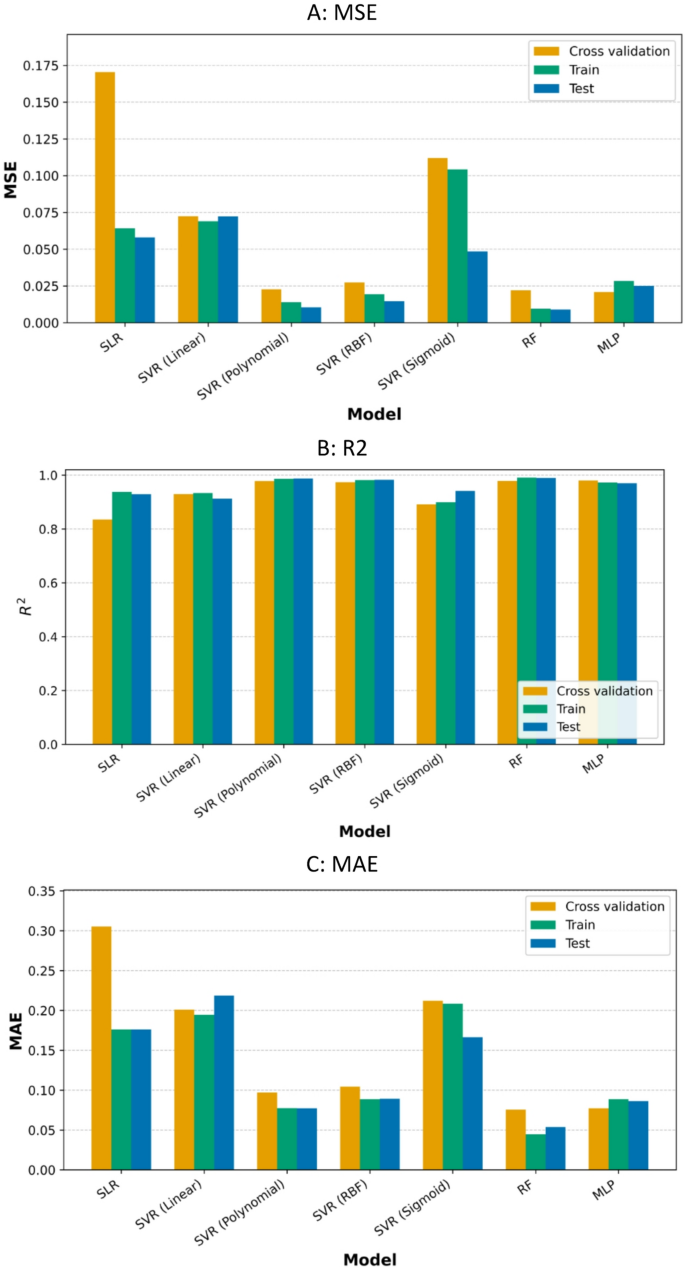
Performance metrics (A: MSE, B: R2, and C: MAE) in cross validation, train dataset, and test dataset for seven regression models: SLR, SVR (linear, polynomial, RBF, sigmoid), RF, and MLP.
Overfitting and underfitting are key considerations when evaluating a model’s ability to generalize to unseen data. As shown in Fig. 8—A, the training and test MSE values are closely aligned across all algorithms, indicating minimal overfitting. Furthermore, as shown in Fig. 8—B, the R2 scores—except for SVR with a sigmoid kernel—differed by less than 3% between the training and test sets, reinforcing the models’ generalizability. The likelihood of underfitting is also low, as evidenced by the high accuracy achieved on both the training and test datasets, and the use of a sufficiently sized test set (20%) (Fig. 2).
Figure 8 — C presents the MAE values, offering further insight into model precision. Ensemble-based models such as RF and MLP, along with SVR models using RBF and polynomial kernels, demonstrate strong predictive accuracy, with average errors below 0.1. In contrast, SLR and SVR models with sigmoid or linear kernels exhibit substantially higher test MAE values, indicating greater prediction errors and reduced reliability.
Permutation feature importance
Table 9 and Fig. 9 display the permutation feature importance scores for each input feature across all regression models. Each value reflects the average decrease in model performance when the corresponding feature is randomly shuffled. Higher values indicate greater importance of the feature in influencing the model’s predictions. Among all features, force consistently exhibits the highest importance across models, consistently exhibiting the highest importance scores, ranging from 1.38 to 1.70. Beyond force, hardness and weight reducing holes midsole contributed meaningfully to predictions in more complex, nonlinear models.
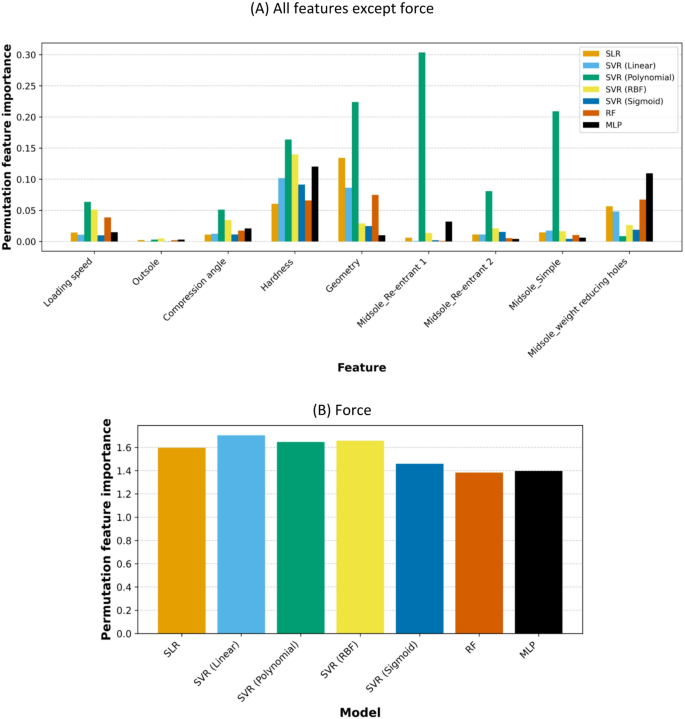
Permutation feature importance for SLR, SVR models (Linear, Polynomial, RBF, Sigmoid), RF, and MLP. Due to the significantly larger magnitude of the force feature’s importance compared to the other features, it is excluded from (A) and shown separately in (B).
Ensemble-based models were more aligned with the Tukey results (Table 3). MLP, which excels in modeling nonlinear and high-dimensional patterns, ranked hardness (0.1203) and midsole weight-reducing holes (0.1094) among the top contributors after force. Interestingly, RF also highlighted midsole weight-reducing holes (0.0673) and hardness (0.0659) among important features. Owing to their ensemble-based nature, RF and MLP effectively capture these correlations. In contrast, SVR models with RBF and polynomial kernels, while achieving good accuracy, fail to distinguish the effectiveness of weight-reducing holes from other sole structures, a result that diverges from the Tukey test findings. Despite both being ensemble-based, RF and MLP differ in their assessment of geometry: RF ranked it as the second most effective variable (0.0749), whereas MLP ranked it among the least effective (0.0100). Even weaker models, such as SLR, SVR (Linear), and SVR (Sigmoid), identified hardness, geometry, and weight-reducing holes midsole as important; however, due to their lower accuracy, their results may not be considered reliable.