Though the filibuster confounds this somewhat, it really is telling that the only consolidated government shut downs occurred during Carter (and that among the shortest on this list) and twice now with Trump.
morbious37 on
Can we get this graphic with whether there’s a filibuster-proof majority in the senate?
HadeStyx on
He’s gotta OWN the libs – set a NEW RECORD! Nobody’s ever had a better government shutdown, folks. People are saying it’s the BEST shutdown in HISTORY. Total WIN! 💯🇺🇸 #MAGA #Winning /s
bijomaru78 on
The most tremendous shutdowns.
CynicalPotato95 on
And yet, Trump blames the Democrats for it 😅
-Fahrenheit- on
To be accurate, the 35 day long Trump 2018/2019 should have a mixed House color, the House was under Republican control for like the first 10-12 days of that that 35, before the Democratic majority was sworn in in early January of 2019.
Jayrate on
The 2018-19 is misleading: the shutdown started with republican unified control of government and ended with a democratic House. Showing the government makeup at the end of the shutdown overstates democrats’ contribution to it (which in reality was none – Trump was vetoing bipartisan bills to shut it down).
iknowiknowwhereiam on
I just donated to my local food pantry and it made me so mad. Not that I mind donating, but I would rather do it because I want to and can help supplement rather than because I know the government is so non-functional at this point they can’t even hand out SNAP benefits to people that are starving.
Radiant-Spot-128 on
If they are still taking my money through taxes but stopping the benefits, where is my money going to then? Serious question.
madg0at80 on
It shouldn’t be surprising that the big upswing in both frequency and duration started in 1995, immediately after Newt Gingrich rode into the House speakership. His no-compromise, take no prisoners, approach to governance started the GOP on its current trajectory.
Rehcamretsnef on
When liberals learn some other phrase than “we just need more of your money”, they might find the issue with the fact a graph like this even exists.
gentlemantroglodyte on
Note that this graph starts in 1980, when the opinion of an attorney general invented them. Before that, shutdowns did not exist.
Nik_Tesla on
So basically, half of the time that the government has *ever* been shut down, was under Trump’s watch.
JTgdawg22 on
Yet another propaganda post for r/dataispropaganda.
1. The obvious implication is that majority house/senate matter and that republicans are causing prolonged shutdowns. What does matter, as is the case today is having 60 seats in the senate to pass a continuing resolution.
2. The republicans have passed it in the house and have voted over 12 times to pass the straight, clean continuing resolution (government is funded to the full spending as it was prior to the shutdown) and the democrats have repeatedly voted this down for partisan politics.
3. The democrats are actively spreading propaganda through people like OP u/CognitiveFeedback in order to spread misinformation to not blame the responsible people which are the democrats.
4. If read properly, this chart shows republicans not holding the government and people on SNAP hostage, repeatedly, while not having the majority as the democrats are doing today.
This is the objective truth:
1. You need 60 (Repubs have 53) votes to pass a continuing resolution in the senate which is necessary
2. Republicans in the senate have voted 12+ times to pass a continuing resolution, unified with all republicans voting yes
3. The continuing resolution is by default bi-partisan and “clean” as it maintains all current spending levels
4. Senate Democrats have chosen to keep the government shutdown for this period of time due to their own partisan politics and are using the most vunerable to do that.
Edit: Of course, all you propagandists can do is downvote. Everything I said is true. The reality does not care about your propaganda.
Cl987654322 on
I’d love to see some data showing what the actual negative impacts are when these shutdowns happen. I.e. is it exponentially worse the longer it goes?

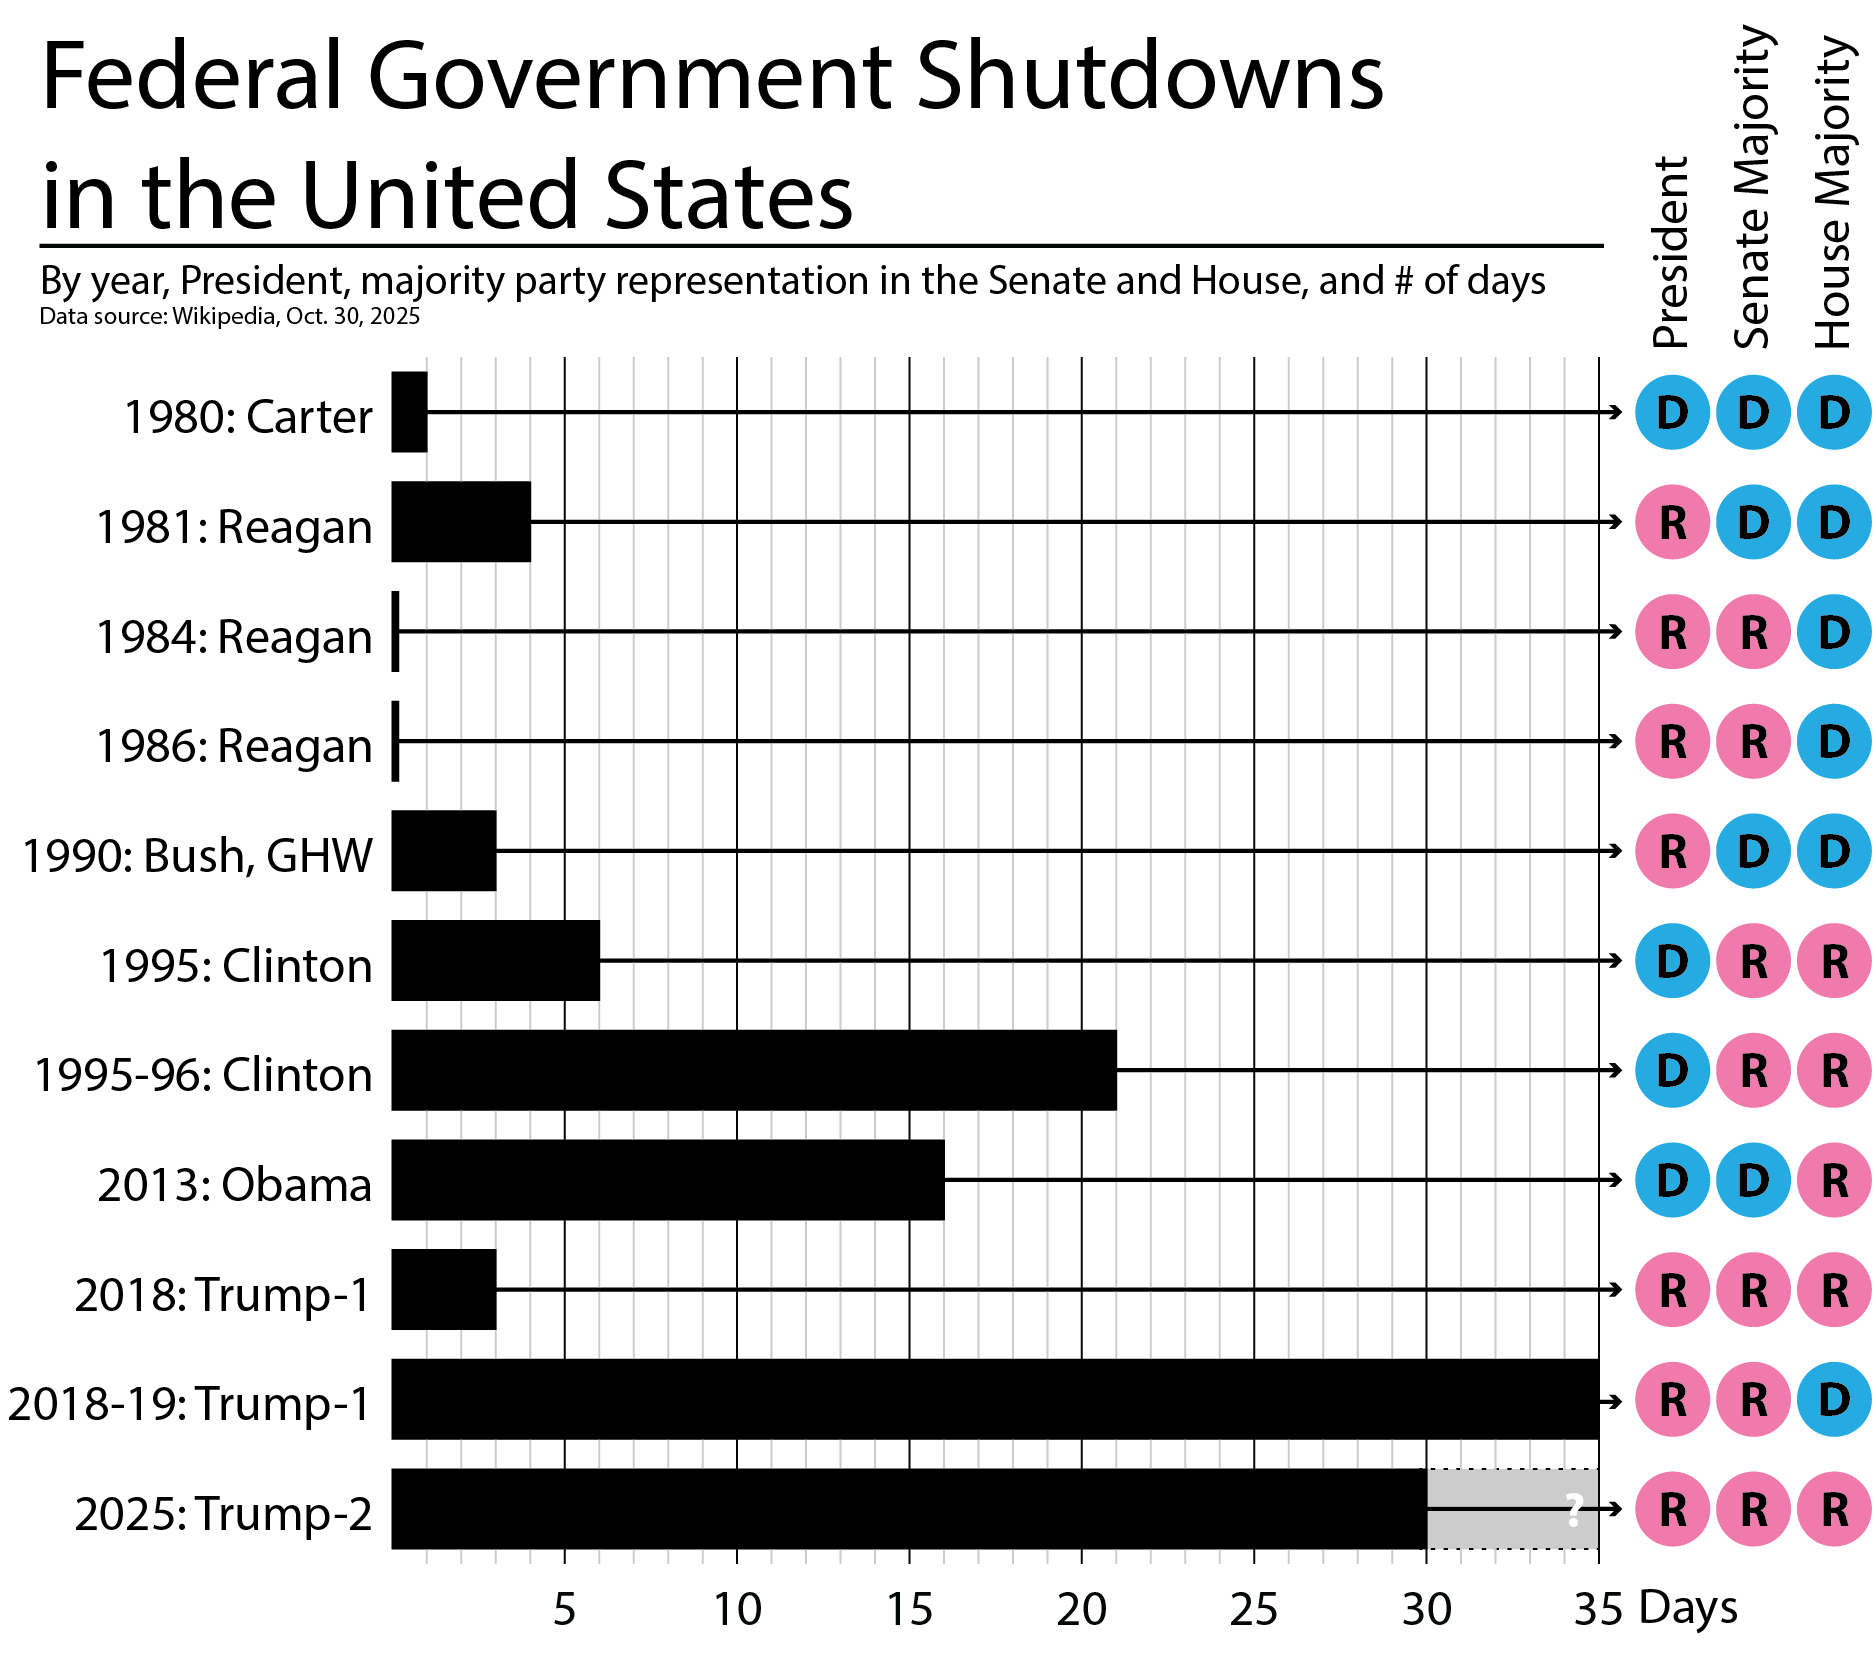
![Government shutdowns in the U.S. [OC]](https://www.byteseu.com/wp-content/uploads/2025/10/717hbtwva9yf1-1536x1371.png "Government shutdowns in the U.S. [OC]")
16 Comments
Created in Illustrator, data gathered from Wikipedia Oct. 30, 2025: [https://en.wikipedia.org/wiki/Government_shutdowns_in_the_United_States](https://en.wikipedia.org/wiki/Government_shutdowns_in_the_United_States)
Though the filibuster confounds this somewhat, it really is telling that the only consolidated government shut downs occurred during Carter (and that among the shortest on this list) and twice now with Trump.
Can we get this graphic with whether there’s a filibuster-proof majority in the senate?
He’s gotta OWN the libs – set a NEW RECORD! Nobody’s ever had a better government shutdown, folks. People are saying it’s the BEST shutdown in HISTORY. Total WIN! 💯🇺🇸 #MAGA #Winning /s
The most tremendous shutdowns.
And yet, Trump blames the Democrats for it 😅
To be accurate, the 35 day long Trump 2018/2019 should have a mixed House color, the House was under Republican control for like the first 10-12 days of that that 35, before the Democratic majority was sworn in in early January of 2019.
The 2018-19 is misleading: the shutdown started with republican unified control of government and ended with a democratic House. Showing the government makeup at the end of the shutdown overstates democrats’ contribution to it (which in reality was none – Trump was vetoing bipartisan bills to shut it down).
I just donated to my local food pantry and it made me so mad. Not that I mind donating, but I would rather do it because I want to and can help supplement rather than because I know the government is so non-functional at this point they can’t even hand out SNAP benefits to people that are starving.
If they are still taking my money through taxes but stopping the benefits, where is my money going to then? Serious question.
It shouldn’t be surprising that the big upswing in both frequency and duration started in 1995, immediately after Newt Gingrich rode into the House speakership. His no-compromise, take no prisoners, approach to governance started the GOP on its current trajectory.
When liberals learn some other phrase than “we just need more of your money”, they might find the issue with the fact a graph like this even exists.
Note that this graph starts in 1980, when the opinion of an attorney general invented them. Before that, shutdowns did not exist.
So basically, half of the time that the government has *ever* been shut down, was under Trump’s watch.
Yet another propaganda post for r/dataispropaganda.
1. The obvious implication is that majority house/senate matter and that republicans are causing prolonged shutdowns. What does matter, as is the case today is having 60 seats in the senate to pass a continuing resolution.
2. The republicans have passed it in the house and have voted over 12 times to pass the straight, clean continuing resolution (government is funded to the full spending as it was prior to the shutdown) and the democrats have repeatedly voted this down for partisan politics.
3. The democrats are actively spreading propaganda through people like OP u/CognitiveFeedback in order to spread misinformation to not blame the responsible people which are the democrats.
4. If read properly, this chart shows republicans not holding the government and people on SNAP hostage, repeatedly, while not having the majority as the democrats are doing today.
This is the objective truth:
1. You need 60 (Repubs have 53) votes to pass a continuing resolution in the senate which is necessary
2. Republicans in the senate have voted 12+ times to pass a continuing resolution, unified with all republicans voting yes
3. The continuing resolution is by default bi-partisan and “clean” as it maintains all current spending levels
4. Senate Democrats have chosen to keep the government shutdown for this period of time due to their own partisan politics and are using the most vunerable to do that.
Edit: Of course, all you propagandists can do is downvote. Everything I said is true. The reality does not care about your propaganda.
I’d love to see some data showing what the actual negative impacts are when these shutdowns happen. I.e. is it exponentially worse the longer it goes?