
![[OC] I Analyzed Morning Traffic Patterns in Los Angeles](https://www.byteseu.com/wp-content/uploads/2025/10/s3ntnzvvcdyf1-1536x1382.png "[OC] I Analyzed Morning Traffic Patterns in Los Angeles")
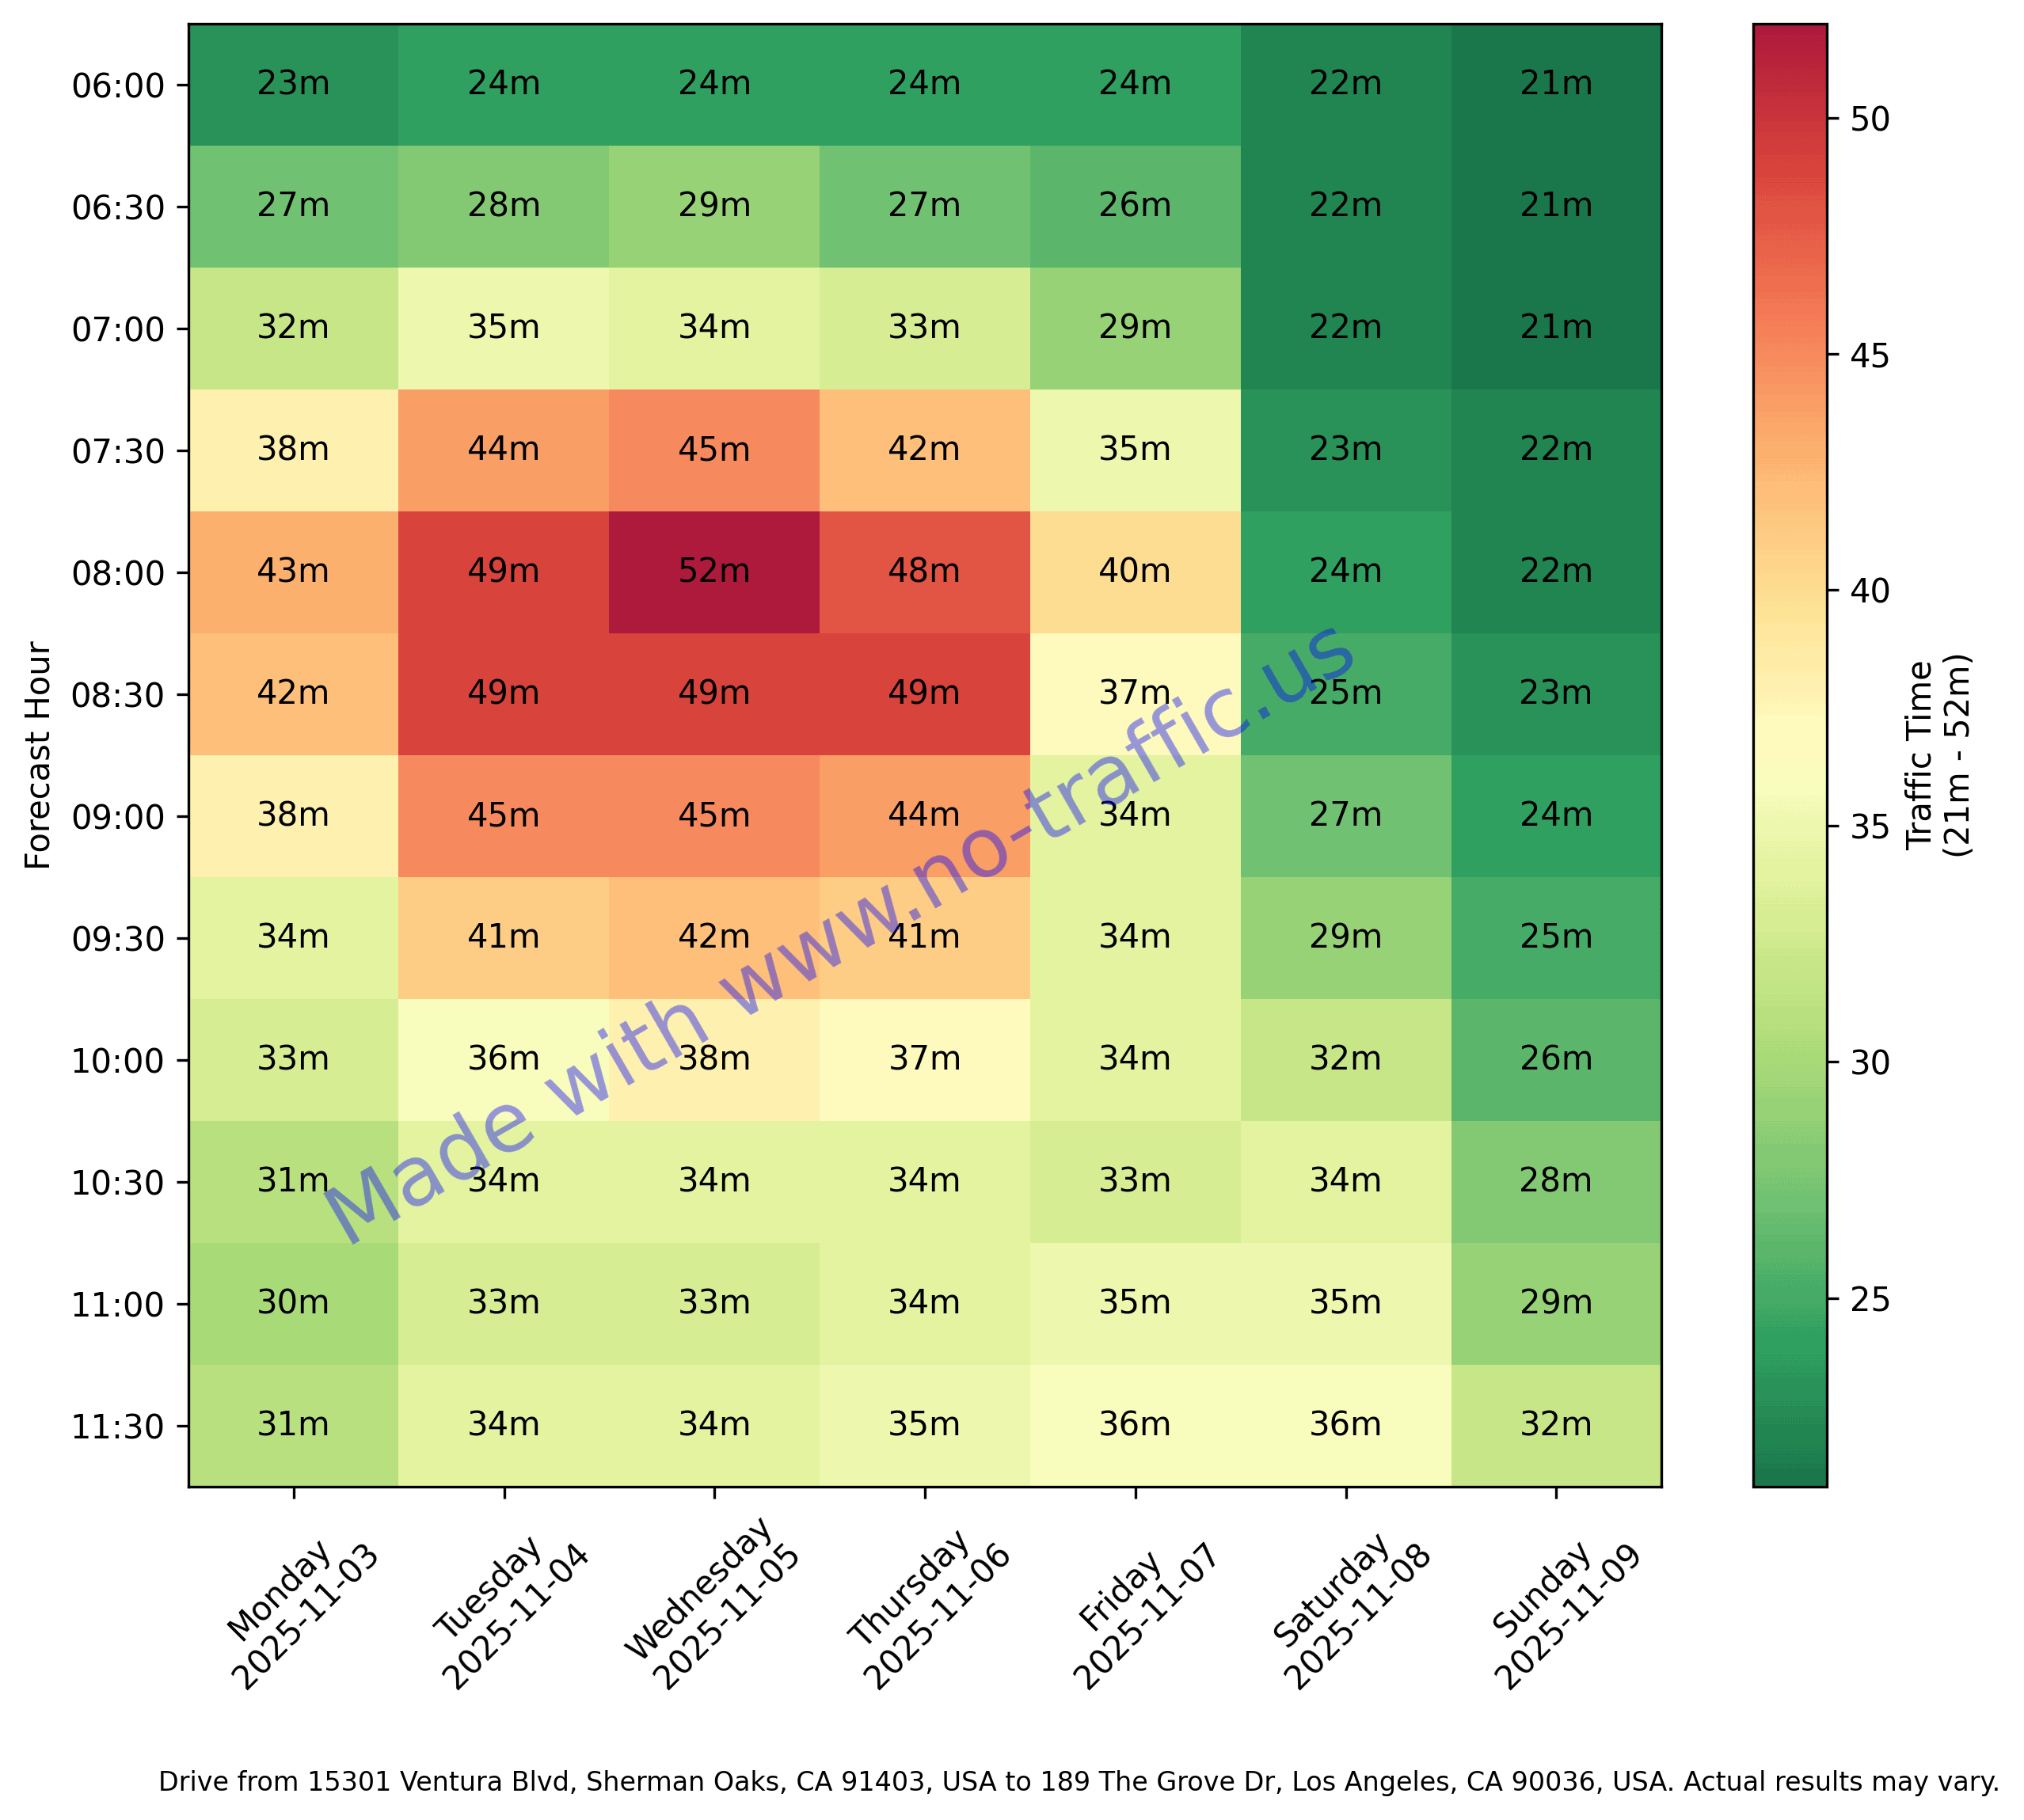
I put together a little Python script to chart out how LA traffic builds up through the morning. It’s weirdly satisfying watching rush hour turn into data.
Traffic data is from Google Maps API. The tool is available for everyone.
Posted by CacheSquirrel
5 Comments
Am I trippin or is this data supposed to be for NEXT week?
Everytime I c a chart like this I just assume it’s the Game of Thrones episode rankings
Really interesting analysis of part-time and work from home patterns. People are in the office on Wednesday!
if California worked on the East Coast time, they would save a lot of time and gas (!?) and would be done by 2 pm.
wake up people!
this is great. I wish Google had a feature like this. I would use it when setting up appointments.